Latest Entries »


One of the greatest and most recent changes in consumer behaviour is the move from high-street shopping to online shopping. Many companies in the UK have maintained or in many cases, increased their profit margins by simply not underestimating the power of online stores. The move to online shopping means that companies must now connect their sales representatives and support staff to their customers which are now online instead of in-store. This is especially important for businesses that place high value items on their online store. This blog seeks to present a response to this challenge.


A look at the use of database dips, custom Java codes, Cisco Contact Centre Express and Cisco Finesse for the improvement of day to day processes and quality of Life. This video was born out of contemplations surrounding what life would entail without the mundane things we spend our time on. Watching A-Level students collecting their certificates /exam results was the final stimuli that prompted this publication.

. .. I hope this Video triggers contemplation.
Thanks for Viewing
Kind Regards
Maxwell


Hint: Double-click the pictures to zoom in

::::::::::::::::::::::::::::::::::::::::::::::::::::::::::::::::::::::::::::

I thought I’d write about a recent issue I observed after there was a sudden power outage to a CVP server which is part of a UCCE 9 estate .

It was noticed that when calls were placed into the UCCE 9.x  contact centre, the calls would never connect; all that would be heard was a fast busy tone before the call was dropped.  So, I  checked the CUBE, PG, ROGGER and CVP and found that all the devices were up  and showing a status of full-service.  However, when I placed the ICM script into debug or monitor mode, I noticed that the calls were failing at the ” run external script” node of the ICM script.

This confirmed two things;

  1. That the problem was on the VRU leg since it was the switch leg that took the calls up to that point in the ICM script.
  2. That  I would probably find the root cause by looking at the VXML gateway and CVP logs.

One of the very important messages that the VXLM gateway sends to the CVP is the Ping message.  In the first screenshot below, notice the highlighted error message as the VXML gateway tried to interact with the CVP server via the http ping/call message? Also, in the second screenshot, notice how the VXML gateway thinks that the CVP server is out of service? This is because the CVP server was not responding even though the CVP server was showing a status of  full-service (in service)on the Operations Console.

At  this stage, I knew that even though the route to  finding the location of the problem was technical, the solution was going to be a very non-technical one indeed.   I guess at this stage you’ve guessed that the solution was 🙂 ? if you haven’t, the solution was a  simple reboot of the CVP server.  And this action  makes sense too because remember I started off by saying that the server had just been ‘ungracefully’ shut-down due to a  power outage? So this highlights one  very important fix for UCCE: if you know the problem  you are troubleshooting was caused by a power outage, try rebooting the affected server as a first step.

Cheers,

Hope this helps someone out there.

bad fetch

call server cannot be reached


[]  The rise of Video conferencing as a preferred means of collaboration advocates for continuous  conversations on the issue of security. This entry seeks to contribute to that discussion.

Hope you find this useful.


Hello and welcome to this entry on Jabber guest. ‘Cisco Jabber Guest is a [Web-Based ] consumer-to-business (C2B) solution that extends the reach of a company’s internal enterprise telephony to people outside of the corporate firewall’ via the aid of a link that is posted or published on the company website. Thus, without any specialised hardware, jabber guest turns a regular webpage into a video/collaborative end-point at the moment that a consumer clicks on the web-based link/hyper-link.   A customer or client is now able to establish high-definition video communication with someone stationed within the internal network or even at a remote location by using a simple browser!

Jabber guest links/hyperlinks can also be embedded into documents and custom apps.

Please view the link below for a quick yet very detailed introduction.

http://youtu.be/n-USuvpNC6c

The video Demonstration  below is part one of two parts.

1) This part (part one) will focus on deploying a  Jabber guest cluster.
2) And part two will focus on integrating the jabber guest cluster with an Expressway cluster
::::::::::::::::::::::::::::::::::::::::::::::::::::::::::::::
Today’s outline.
:::::::::::::::::::::::::::

1) Today I will be deploying Cisco Jabber guest in a cluster of three servers.

3) Then I will configure sip trunks between jabber guest and CUCM

4) After configuring the Jabber guest links on the Jabber guest server, I will then advertise/publish the links to a website.

5) I will then browse to the webpage and click on the link (that was published in step 4) in order to establish a video call between the web-based caller (i.e me) and the internal called device (jabber for windows soft-phone)

The result will be a call between a browser and a jabber for windows client. Enjoy!


Thanks for visiting


Regards!


Hint: Somewhere around 19 min into the recording I mentioned ‘server signing authority’ instead of ‘Certificate signing authority’.  Please process the information accordingly.

The promise of Mobile and remote access technology is that , using the Expressway-C and E servers, external devices are able to register to the corporate network  and  gain access to services  which are located within the corporate LAN without need for a VPN.  Internal services like voice-mail, directory, audio- video calls, on-premises instant message and presence information become transparently and seamlessly available to a mobile and remote devices as they move in and out of the network with no extra user education or involvement.

In the first half this video demonstration, I will:

i) Walk through what we already have configured on the corporate LAN.

In the second half, :

i) I will first of all install the Expressway-C and establish communication between Expressway-C with the internal servers like CUCM and IM&P.

ii) Then the expressway-C  is  connected to the Expressway-E via a traversal zone. The Expressway-E sits in the DMZ. The traversal zone is the link between the internal and external network.

iii) Finally, a jabber client is registered to the network via the Expressway-E. The jabber client is able to access internal services through the aid of the traversal zone that exist between the Expressway-E server that is  on the outside or DMZ of the network  and the Expressway-C server which is inside the network. .

Enjoy


Hint: As long as you are running a TC software that is from version 6.1 and above, you definitely have to make this change.

Hint: This work-around will not solve all call merge issues as a lot of call merge issues are ‘timer’ related. This solution is for Bug :  CSCug95623

Hint: I have also seen this error in the logs taken from endpoints that have their Ethernet settings set to auto instead of full.

Today I will be sharing a case I recently worked on  that involved several SX20 codecs, Cisco Video Communication servers and one Multipoint Control Unite (MCU). The problem was that  calls were failing to merge . As Network Professionals we know that a number of things can cause video conference calls to fail so what I’m going to do today is to first of all talk about the symptoms of this case  before talking about the solution. After talking about the solution, I will discuss how to identify this problem when looking at the logs.

Symptoms:

::::::::::::::::::::::::::::::

1)     A caller calls another video endpoint and then calls a third endpoint/person while the other caller is placed on hold.

2)     The conference initiator presses the merge button in an attempt to merge all three participants into one call. Normally, what happens in the background when a conference initiator presses the merge button is that all participants get redirected to the Conference Bridge (simplified explanation) or Multipoint Control Unit (MCU).

3)     However, on this occasion, the initiator simply saw a message saying ‘merge failed’ and the person that  was placed on hold before; remained on hold.  Please take note of the symptom that I have just explained because it is really crucial to knowing where the fault is.  Let me explain further: A few weeks ago I worked on another case where endpoints could not initiate a video conference (MCU conference). On that occasion, when the conference initiator pressed the merge button and everyone got redirected to the MCU; a ‘merge failed’ message was displayed and everyone got disconnected and no one remained on hold. This  failure was due to an incompatible sip timer issue between the endpoints and the MCU. But in this case that I am talking about in this blog, I noticed that the call remained on hold. Does this not make you think that the call was never redirected to the MCU because the first caller never left its ‘hold’ state that it was placed in before the call merge attempt? If you did not get that question, after reading the rest of this blog, please come back to this question and it will make sense. It is very important and in everyone’s benefit that anyone interested in this post is able to answer this question.

Solution:

:::::::::::::::::::::::::

Let me now provide the solution. The solution is to change the Sip profile of the Video endpoint from ‘ Cisco’ to ‘ Standard’.

1)     Log into the Video endpoint (eg SX20),  click the ‘ configuration’  menu

2)     Select ‘ system configuration’

3)     Select ‘ SIP’

4)     Select ‘standard’ as the ‘ Type’ instead of ‘ Cisco’ Standard Log analysis and detailed explanation:

::::::::::::::::::::::::::::::::::::::::::::::::::::::::::::::::::

As I mentioned before, when a conference initiator presses the merge button, a request is sent to the Video communication server with the multiway address as the destination. The video communication server understands that this is  conference request so   the video communication server checks the ‘conference factory’ configuration and responds back by sending back an address for which all conference participants  should  re-converge at. This address will be an address on the Multipoint Control Unit (MCU). The summary of the logs below shows  that  the  conference-initiating-endpoint  sends as  an incorrect multiway address to the VCS  even though the multiway address is configured correctly on the endpoint. So in response, the VCS basically comes back and tells the endpoint that it does not know that address so the call (merge) fails. These logs were taken from an SX20

Here is what the problem looks like in the logs

Jan  8 13:56:39.483 a8 appl[1592]: 1749764.49 MainEvents I: GenericTransferEvent() ‘MultiwayStarted

Jan  8 13:56:39.509 a8 appl[1592]: 1749764.52 SipPacket I: PacketDump: Proto: SIP, Direction: Outgoing, Name: REFER, CSeq: 101 REFER, RemoteAddress: 10.86.24.90:5061, CallId: 55c9039b4884ec8f0c834997b05cfa10,Time: 1749764517 Jan  8 13:56:39.520 a8 appl[1592]: 1749764.53 SipPacket   Call-ID: 55c9039b4884ec8f0c834997b05cfa10

Jan  8 13:56:39.520 a8 appl[1592]: 1749764.53 SipPacket   CSeq: 101 REFER Jan  8 13:56:39.525 a8 appl[1592]: 1749764.53 SipPacket   Content-Id: <3ac0bec2e9862d4b@127.0.0.1>

Jan  8 13:56:39.527 a8 appl[1592]: 1749764.54 SipPacket   Contact: <sip:812000@voiceinitiate.com;gr=urn:uuid:00000000-0000-0000-0000-d867d97810fa>

Jan  8 13:56:39.528 a8 appl[1592]: 1749764.54 SipPacket   Refer-To: <cid:3ac0bec2e9862d4b@127.0.0.1>

Jan  8 13:56:39.528 a8 appl[1592]: 1749764.54 SipPacket   Referred-By: <sip:812000@voiceinitiate.com>

Jan  8 13:56:39.534 a8 appl[1592]: 1749764.54 SipPacket   From: <sip:812000@voiceinitiate.com>;tag=c280f01b2b95aae4 Jan  8 13:56:39.535 a8 appl[1592]: 1749764.54 SipPacket   To: <sip:124758@10.20.40.10>

Jan  8 13:56:39.535 a8 appl[1592]: 1749764.54 SipPacket   Max-Forwards: 70 :::::::::::::::::::::::::::::::::::::::::::::::::::::::::::::::::::::::::::::::::::::::::::::::::::::::::::::::::::::::::::::::::::::::::::::::::::::::::::::::::::::::::::::::::::::::::::

so here is the explanation for the logs shown above:

1)Because the user pressed the merge button, the SX20 endpoint tries to transfer the call to the MCU so it ‘Refers’ the call to the MCU

2)       by sending a refer message to the VCS at Ip address: 10.86.24.90

3)       The SX20 tell the VCS to refer the call to ‘ Refer-To: cid:3ac0bec2e9862d4b@127.0.0.1’; which is basically an incorrect  address. Notice that the ip address of the refer url is actually a loopback address which is not the ip address of the MCU ? So basically the endpoint it trying to refer the call to itself when it does not have multisite capabilities. Even though it needs the MCU to host the conference, the SX20 actually tries to host the call. . A refer to  :3ac0bec2e9862d4b@127.0.0.1 is not the same thing as Refer-To: multiway@voiceinitiate.com so it fails.

4)       See the logs  below for the response that the Video communication server sent back to the SX20 :::::::::::::::::::::::::::::::::::::::::::::::::::::::::::::::::::::::::::::::::::::::::::::::::::::::::::::::::::::::::::::::::::::::::::::::::::::::::::::::::::::::::::::::::::::::::::

The VCS responds back basically saying ‘ I don’t know that address’ : We know this because we see can see  a 400 message in the logs.  A 400 message means that the requester sent a bad request with a malformed syntax.

::::::::::::::::::::::::::::::

a8 appl[1592]: 1749764.68 SipPacket I: PacketDump: Proto: SIP, Direction: Incoming, Name: 400 (Refer-To) Unknown SIP URL prefix, CSeq: 101 REFER, RemoteAddress: 10.86.24.90:5061, CallId: 55c9039b4884ec8f0c834997b05cfa10, Time: 1749764678

Jan  8 13:56:39.682 a8 appl[1592]: 1749764.69 SipPacket   SIP/2.0 400 (Refer-To) Unknown SIP URL prefix

:::::::::::::::::::::::::::::::::::::::::::::::

As  can be seen in the logs, this is very abnormal behaviour.when I complained about what I was seeing in the logs to  Cisco, I was informed that this was actually bug CSCug95623. As of today, I believe this bug is not officially published yet.   Hope this has been helpful. All the best


* Hint: Please watch this Video in  HD and full-screen mode or the Video may not be clear.


Not too long ago I hit a brick wall while I was configuring the ‘ Recording’ feature of   Cisco’s On-Premises Webex Meeting Server . The problem was that the webex meeting server was saying that it could not find my Network file system. The recording feature actually requires that a Network File System be set-up before users are allowed to record their meetings.  I checked on Cisco’s support site and found out that I was not the only one to have encountered this problem.  Anyway, since I did not find a solution at Cisco.com, I decided to recreate my solution here so that the next person that encounters this problem will have a quicker solution than I had.

Hope this post is  helpful to everyone and maybe even someone who’s blog has been useful to me too.

cheers

Maxwell


This is another attempt to share what I’ve researched in my personal time with other Engineers simply because  I have benefited  a lot  from reading  other people’s blogs also.  My  hope is that this post is useful to someone out there.

Not too long ago, I wrote a post about  the boot process of Cisco jabber for windows which can be found    here.  In continuation of this entry, I thought I’d add share some more  information on how to read the logs that are generated  when  two people who are  on  Cisco Jabbber clients start chatting or sharing screenshots with each other.

Knowing what to expect in these logs could prove very important if a client complains to you that when he sends chat message to someone the message is never delivered.  Anyway, before I start talking too much, lets begin.

Lets starting of by talking about the trace file  that should be  used when looking into the chat messages or picture exchange between tw0 people on jabber clients.   In this regard, the best trace to collect is the XCP Connnecton Manager traces.  It is also advisable to set the trace level to detailed before attempting to collect the trace file. So the question is,  ‘why the XCP Connection manager trace’ ? Well the XCP Connection Manager  helps jabber clients to connect to the IM and Presence Server. It is sort of like an intermediary.

Now that we have that under our belt, the nex thing to know is how to differnciate one chat message for another in a massive pile of traces.

There are several things unique to every chat conversation:

1)   The sender and the receiver’s jabber ID  (JID)

2)  Every message has a Unique ID which is used to identify a message as it is transported across multiple  IM and presence servers en-route to it’s destination or jabber user.

When reading jabber traces, the same rule that applies to phones and call-manager applies here too:  and that is, you will mostly only find the logs for a given jabber client on the server that it is registered to.  This is true for the XCP Connection Manager traces.  What I’m trying to say here is that sometimes you have to collect logs from multiple IM and presence servers but most of the interesting logs will piled up in one server.

Now that we understand that, let talk briefly about the message flow.

For every chat message/ conversation there are several  messages that are exchanged  in the following order.

1) One of the very first messages is the   “IN FROM CLIENT” message. This is the trace line that tells us that someone has sent a message via the XCP Connection Manager  to the IM and presence server using a jabber client.

2)   “OUT TO SERVER” message. This means that the message has now been transferred to the IM and Presence server’s internal processes so that  a destination for the message can be calculatated or derived. It is at this stage that components like the XCP Router kicks in.

3) ” IN FROM SERVER” message. This is the message that  instructs an IM and presence node to deliver a message to a particular XMPP client. i.e jabber.  Please note that if jabber clients are chatting with each other but they are not registered to the same IM and Presence node, you will never see an  “OUT TO SERVER” and an ” IN FROM SERVER” message together on any single node for one conversation going in one direction (i.e from sender to receiver).

4)   Then there is the  “OUT TO CLIENT ” message. This is one of the final messages you will see in the logs when a message is about to be  delivered to  a recipient jabber client.

Ok now that we’ve discussed this matter at length, let take a look at some logs.

In the logs below, user2@voiceinitiate.com sends a message to  User1@voiceinitiate.comand a message ID of 52a46470:00000990:0000010c is assigned to the message

:::::::::::::::::::::::::::::::::::::::::::::::::::::::::::::::::::::::::::::::::::::::::::::::::::::::::::::::::::::::::::::::::::::::::::::::::::::::::::::

[IN FROM CLIENT state:6]: <message id=’uid:52a46470:00000990:0000010c to=’user1@voiceinitiate.com’ type=’chat’><body>hello this is maxwell. i am having a cup of tea so feel free to play your xbox at work</body><thread>connect23313xmlns=’http://jabber.org/protocol/xhtml-im’&gt;hello this is maxwel. i am having a cup of tea so feel free to play your xbox at work

:::::::::::::::::::::::::::::::::::::::::::::::::::::::::::::::::::::::::::::::::::::::::::::::::::::::::::::::::::::::::::::::::::::::::::::::::::::::::::::

The Jabber session manager  (cm-1_jsm-1) that is running on server “subcup.voiceinitiate.com”,  informs us that this  message is being sent out to the server’s internal processes for analysis and message delivery

::::::::::::::::::::::::::::::::::::::::::::::::::::::::::::::::::::::::::::::::::::::::::::::::::::::::::::::::::::::::::::::::::::::

cm-1_jsmcp-1.subcup-voiceinitiate-com [OUT TO SERVER(3)]: from=‘user2@voiceinitiate.com/jabber_22990 id=’uid:52a46470:00000990:0000010c to=’user1@voiceinitiate

:::::::::::::::::::::::::::::::::::::::::::::::::::::::::::::::::::::::::::::::::::::::::::::::::::::::::::::::::::::::::::::::::::::::::::

In the  output below, the  Jabber session manager  (cm-1_jsm-1) that is running on server “pubcup.voiceinitiate.com”,  informs us that it has received a request to deliver   message to user1@voiceinitiate.com to user2@voiceinitiate.com

:::::::::::::::::::::::::::::::::::::::::::::::::::::::::::::::::::::::::::::::::::::::::::::::::::::::::::::::::::::::::::::::::::::::::::

cm-1_jsmcp-1.pubcup-voiceinitiate-com [IN FROM SERVER]: from=’user2@voiceinitiate.com/jabber_22990′ id=’uid:52a46470:00000990:0000010c’ to=’user1@voiceinitiate.com’ type=chat’ xml:lang=’en’><body>hello this is maxwell. i am having a cup of tea so feel free to play your xbox at work</body>connect23313xmlns=’http://jabber.org/protocol/xhtml-im’&gt;hello this is maxwel. i am having a cup of tea so feel free to play your xbox at work

 :::::::::::::::::::::::::::::::::::::::::::::::::::::::::::::::::::::::::::::::::::::::::::::::::::::::::::::::::::::::::::::::::::::::::::

In the logs below, we see that the  message is delivered to the recipient jabber client.

:::::::::::::::::::::::::::::::::::::::::::::::::::::::::::::::::::::::::::::::::::::::::::::::::::::::::::::

cm-1_jsmcp-1_xmppd-1 [OUT TO CLIENT]: <message from=’user2@voiceinitiate.com/jabber_22990′ id=’uid:52a46470:00000990:0000010c’ to=’user1@voiceinitiate.com type=chat xml:lang=’en’>hello this is maxwell. i am having a cup of tea so feel free to play your xbox at workconnect23313xmlns=’http://jabber.org/protocol/xhtml-im’&gt;hello this is maxwel. i am having a cup of tea so feel free to play your xbox at work

:::::::::::::::::::::::::::::::::::::::::::::::::::::::::::::::::::::::::::::::::::::::::::::::::::::::::::::::::::::::::::::::

Ok so now that we know how text/ chat messages flow within the server(s), how about when we send a screen-shot to someone via jabber? Well  the snapshot below shows me sending a picture from one jabber client to another . I will not show you the full message follow because we already have a general idea of what to expect. However, what  I will show here is the actual traces that showed what was happening in the background as the picture  was being sent.

Let me first of show you the  actual screen-shot  that I took while the picture was being transferred between jabber clients. Pay special attention to the name of the file and see if you can see  that same file name in the the logs below.

jabber

cm-1_jsmcp-1_xmppd-1 [OUT TO CLIENT]: <iq from=’user1@voiceinitiate.com/wbxconnect’ id=’uid:52a45b16:00004d03:000001a7‘ to=user2@voiceinitiate.com/jabber_22990′ type=’set’ xml:lang=’en’>Successfully sent file user1@voiceinitiate.com_20131208_150328.png(13613 bytes)’.</x></jingle></iq>

 :::::::::::::::::::::::::::::::::::::::::::::::::::::::::::::::::::::::::::::::::::::::::::::::::::::::::::::::::::::::::::::::::::::::::::

The logs above withe XCP Connections Manager logs. Now the presence Engine logs are even more interesting. Check out the logs below that even tells you were the file was saved on the computer hard-drive.

 :::::::::::::::::::::::::::::::::::::::::::::::::::::::::::::::::::::::::::::::::::::::::::::::::::::::::::::::::::::::::::::::::::::::::::

system.pe.jabber 1308670 INFO ClientEmComponent::onPacket() – PACKET RECEIVED::  <message from=’user1@voiceinitiate.com/wbxconnect’ to=’user2@voiceinitiate.com type=’chat’ xml:lang=’en’> xmlns=’http://webex.com/connect/imcmd’/>Subject&lt;body xmlns=’http://www.w3.org/1999/xhtml’>&lt;img alt=’Screen capture contenteditable=’false’ id=user1@voiceinitiate.com_20131208_150328.png’ name=‘connect_screen_capture src=’file:///C:/Documents%20and%20Settings/user1/My%20Documents/MyJabberFiles/user1@voiceinitiate.com/user1@voiceinitiate.com_20131208_150328.png/></body></html></message>

Anyway, I hope that what has been shared here today will come in handy to someone down the line.

All the best

Maxwell


This blog entry was never intended to be made public  but as I have picked up  so many things from reading other people’s blogs, I thought I’d add this entry here in case its of use to anyone . Anyway, the reason behind this work is very simple: In order to find a problem when looking at the logs of broken device, you first of all need to know what they look like when everything is working fine.

The following is an output from  the jabber logs (CSF-UNIFIED.LOG)that I collected from one of my Lab PC (s) running jabber 9.1.5  that was  registered to cucm and presence server 9.x.

Jabber  processes are starting.

————————————————–

Starting new instance of Cisco Jabber

————————————————–

[lugin-runtime\impl\PluginRuntime.cpp(93)] [plugin-runtime] [initialize] – Initializing plugin runtime

\JabberCoreUiPlugin.cpp(48)] [plugin-runtime] [initPlugin] – Jabber Core UI Plugin initializing...

Jabber front-end /


IMPStackCap::StackManager::initialise] – LoginMgr started…

[IMPStackCap::StackManager::initialise] – PresenceClient started

[IMPStackCap::StackManager::initialise] – Config started…

2013-12-01 00:27:31,448 INFO  [0x000003c8] [esets\adapters\imp\StackManager.cpp(118)] [csf-unified.imp.stackManager] [IMPStackCap::StackManager::initialise] BuddyList started…

2013-12-01 00:27:31,448 INFO  [0x000003c8] [esets\adapters\imp\StackManager.cpp(121)] [csf-unified.imp.stackManager] [IMPStackCap::StackManager::initialise] – Presence started…

2013-12-01 00:27:31,448 INFO  [0x000003c8] [esets\adapters\imp\StackManager.cpp(124)] [csf-unified.imp.stackManager] [IMPStackCap::StackManager::initialise] – IMP2P started

[csf-unified.imp.stackManager] [IMPStackCap::StackManager::initialise] Group Chat started

csf-unified.imp.stackManager] [IMPStackCap::StackManager::initialise] – EnterpriseGroups started

csf-unified.imp.stackManager] [IMPStackCap::StackManager::initialise] – …Initialized

::::::::::::::::::::::::::::::::::::::::::::::::::::::::::::::::::::::::::::::::::::::::::::::::::::::::::::::::::

In the output below, the jabber client notices that I did not configure any ip or dns names in the jabber client so  jabber decides that it will have to dynamically sends out a DNS service request (SRV) request to the DNS server that is configured on the local network interfaces card in order to find out the IP address of the presence server. However, before doing that, it checks whether it has any presence server  IP-addresses stored locally in its database–and because this is not the first time that jabber has found this server, it discovers a cashed copy of its presence server host-name and uses it  It then goes on to login with my user-ID of ‘ user2’. In case you are reading this and wondering how jabber manages to  find its presence/webex server without having it configured on the jabber client,  just copy the following into Google and you will find everyone talking about it :   _cuplogin._tcp

:::::::::::::::::::::::::::::::::::::::::::::::::::::::::::::::::::::::::::::::::::::::::::::::::::::::::::::::::::

[AddUpdateSubItem] – Setting Status:  status of Presence to Connecting

No CUP server specified, will attempt DNS SRV with domainlist: voiceinitiate.com

[LoginMgr.dll]: LoginMgrImpl::Login, type:1, serv:, user:user2, resource:jabber_6742, jw-ver:0.9.2.4420, app-ver:9.2.6.12639

[LoginMgr.dll]: login, clear login data. deep:1

[LoginMgr.dll]: dns, cup-domain:voiceinitiate.com

[LoginMgr.dll]: CLoginContext::ChangeState now:1 auto:0

[LoginMgr.dll]: CGetProxy::Connect login, CGetProxy::Connect

[LoginMgr.dll]: CLoginContext::ChangeState now:1 auto:0

[LoginMgr.dll]: dns, login, with cached cup server:pubcup.voiceinitiate.com

[LoginMgr.dll]: CLoginCup::_connect

[LoginMgr.dll]: ha, soap-servers:pubcup.voiceinitiate.com

[LoginMgr.dll]: login, cup:pubcup.voiceinitiate.com

inCommands::SignOn] –

[csf-unified.imp.LoginCommands] [IMPStackCap::LoginCommands::SignOn] Signing into Presence Server. Account: user2, server: , login mode: ON_PREM, result: 0

::::::::::::::::::::::::::::::::::::::::::::::::::::::::::::::::::::::::::::::::::::::::::::::::::::::::::::::::

Jabber successfully connects to presence server and then verifies the certificate of the presence server.

::::::::::::::::::::::::::::::::::::::::::::::::::::::::::::::::::::::::::::::::::::::::::::::::::::::::::::::::::::

[csf-unified.imp.LoginCommands] [IMPStackCap::LoginCommands::SignOn] – Dispatcher::doExecute] – LoginCommands::SignOnResult: 0

[csf-unified.imp.PresenceAdapter.SignOnState] [SignOnState::isComplete] – isComplete: 0[csf.cert.win32] [cert::Win32CertVerifier::Win32CertVerifier] – Windows CertVerifier constructor

[cert::CertVerifier::checkResult] – finalResult: SUCCESS

::::::::::::::::::::::::::::::::::::::::::::::::::::::::::::::::::::::::::::::::::::::::::::::::::::::::::::::::::::::::::::::::::::::::::::::::::::::::::::::::::::::::::::::::::::::::::::::::::::::::::::::::::

This stage of authentication and certificate verification is now over and Jabber is now engaged in full communication with the  IM and presence server: Connecting with the XMPP component of the  presence server and retrieving data about the CCMCIP (call-manager) server, TFTP server and CTI server now ensues. The client opens an XMPP stream and starts exchanging data with the IM and Presence server .

::::::::::::::::::::::::::::::::::::::::::::::::::::::::::::::::::::::::::::::::::::::::::::::::::::::::::::::::::::::::::::::::::::::::::::::::::::::::::::::::::::::::::::::::::::::::::::::::::::::::::::::::

[IMPStackCap::Log::log] – [LoginMgr.dll]: CLoginCup::OnGetAllConfig

[LoginMgr.dll]: login, jabber, serv:pubcup.voiceinitiate.com

[ [LoginMgr.dll]: login, cup, calc 1-time token(userid:user2@voiceinitiate.com, token:1252341)

[JabberWerx] [IMPStackCap::Log::log] – [XmppSDK.dll]: #0, CXmppClient::Connect , connecting to server by TCP connection……

[JabberWerx] [IMPStackCap::Log::log] – [XmppSDK.dll]: #0, CXmppClient::onStreamEvent ,CXmppClient::onStreamEvent, SessionState_Connecting

::::::::::::::::::::::::::::::::::::::::::::::::::::::::::::::::::::::::::::::::::::::::::::::::::::::::::::::::::::::::::::::::::::::

Jabber client retrieves its  details like ccmcip server , buddy list, tftp server etc .

:::::::::::::::::::::::::::::::::::::::::::::::::::::::::::::::::::::::::::::::::::::::::::::::::::::::::::::::::::::::::::::::::::::::::

[IMPStackCap::RetrieveConfigCommand::RetrieveConfig]  Retrieving config from Presence Server

[IMPStackCap::RetrieveConfigCommand::RetrieveConfig] – Config Retrieved from Presence Server

csf-unified.imp.BuddyListCommands] [IMPStackCap::BuddyListCommands::GetUserJid] – User jid: user2@voiceinitiate.com

[ConfigServiceImpl::OnConfigChanged] – OnConfigChanged key : [CcmcipServer2] value : [192.168.0.12] o

[ConfigServiceImpl::OnConfigChanged] – OnConfigChanged key : [CtiServer1] value : [pubcucm.voiceinitiate.com


::::::::::::::::::::::::::::::::::::::::::::::::::::::::::::::::::::::::::::::::::::::::::::::::::::::::::::::::::::::::::::

Now that that jabber client knows it’s TFTP server, it attempts to download the configuration file.

::::::::::::::::::::::::::::::::::::::::::::::::::::::::::::::::::::::::::::::::::::::::::::::::::::::::::::::::::::::::::::

Old tftpServer1 address:

New tftpServer1 address:192.168.0.12

Old tftpServer2 address:

New tftpServer2 address:

Old tftpServer3 address:

New tftpServer3 address:

Old configurationFile:jabber-config.xml

New configurationFile:

[TftpConfigStore::onConfigAddedOrUpdated] – attemptNewDownload [true]

[attemptTftpFileDownload] – Downloading file http://192.168.0.12:6970/jabber-config.xml………

[csf.ecc] [doGet] – doGet(http://192.168.0.12:6970/user2.cnf.xml)

[csf.ecc] [doGet] – doGet(http://192.168.0.12:6970/CUPC/AppDialRules.xml)

:::::::::::::::::::::::::::::::::::::::::::::::::::::::::::::::::::::::::::::::::::::::::::

The jabber client then tries to register its softphone.

:::::::::::::::::::::::::::::::::::::::::::::::::::::::::::::::::::::::::::::::::::::::::::::::::::

sipio-sent—> REGISTER sip:pubcucm SIP/2.0

Via: SIP/2.0/TCP 192.168.0.9:1588;branch=z9hG4bK00005888

From: <sip:1002@pubcucm>;tag=000c29e2fc390004000060d0-00005d12

To: <sip:1002@pubcucm>

Call-ID: 000c29e2-fc390002-000070b6-00001a66@192.168.0.9

Max-Forwards: 70

Date: Sun, 01 Dec 2013 00:27:36 GMT

CSeq: 102 REGISTER

User-Agent: Cisco-CSF/9.3.2

Sent:REGISTER sip:pubcucm SIP/2.0  Cseq:102 REGISTER CallId:000c29e2-fc390002-000070b6-00001a66@192.168.0.9

::::::::::::::::::::::::::::::::::::::::::::::::::::::::::::::::::::::::::::::::::::::::

Cisco call manager accepts its registration request.

::::::::::::::::::::::::::::::::::::::::::::::::::::::::::::::::::::::::::::::::::::::::::::::

[_SIPCCLoggerFunction] – sipio-recv<— SIP/2.0 200 OK

Via: SIP/2.0/TCP 192.168.0.9:1588;branch=z9hG4bK00005888

From: <sip:1002@pubcucm>;tag=000c29e2fc390004000060d0-00005d12

To: <sip:1002@pubcucm>;tag=833129954

Date: Sun, 01 Dec 2013 00:27:20 GMT

Call-ID: 000c29e2-fc390002-000070b6-00001a66@192.168.0.9

CSeq: 102 REGISTER

Expires: 120

Contact: <sip:6ee27b67-fbf0-5671-2759-64e50cb86304@192.168.0.9:1588;transport=tcp>;+sip.instance=”<urn:uuid:00000000-0000-0000-0000-000c29e2fc39>”;+sip.instance=””;+u.sip!devicename.ccm.cisco.com=”user2″;+u.sip!model.ccm.cisco.com=”503″;video;bfcp

Supported: X-cisco-srtp-fallback,X-cisco-sis-6.0.0

Content-Length: 0

:::::::::::::::::::::::::::::::::::::::::::::::::::::::::::::::::::::::::::::::::::::::

Ok that’s all for now; I will continue to expand this entry whenever I  find time.

For further reading please consider the following links

1)      The basics of XMPP- Envelops, Stanza, Streams etc

http://web.archive.org/web/20120815100411/http://www.adarshr.com/papers/xmpp

2)       For a step by step guide on how to read jabber call flow between two jabber soft-phones      http://www.cisco.com/en/US/partner/products/ps12511/products_tech_note09186a0080c15703.shtml


HINT: If you have soft-phones or Soft Video clients  on your network then this is not for you.  You might want to explore the use of access list instead. 


:::::::::::::::::::::::::::::::::::::::::::::::::::::::::::::::::::::::::::::::::::::::::::

Catalyst 3850 Configuration samples 

:::::::::::::::::::::::::::::::::::::::::::::::::::::::::::::::::::::::::::::::::::::::::::

This configuration was designed to optimize a network that generates 30% Voip and Video  traffic whilst the remaining is bulk data.  This solution is currently  working perfectly in  an extremely busy network. The brief was that the configuration be kept simple yet effective

::::::::::::::::::::::::::::::::::::::::::::::::::::::::::::::::::::::::::::::::::::::::::::::::::::::::::::::::::::::::::::::::::::::::::::::::::::::::::::::::::::::::::::::::::::::::::::::::::::::::::::::::::::::::::::::::

Steps:: 

Create two class maps: The first class maps matches the DSCP  and COS markings of Audio and Video traffic:

class-map rtp_audio_and_video
match dscp af32 af33 cs4 af41 af42 af43 ef
match cos 4 5

class-map signal
description voip signal traffic
match dscp cs3 af31 af32 af33
match cos 3

::::::::::::::::::::::::::::::::::::::::::::::::::::::::::::::::::::::::::::::::::::::::::::::::::::::::::::::::::::::::::::::::::::::::::::::::::::::::::::::::::::::::::::::::::::::::::::::::::::::::::::::::::::::::::::::::

One of the cool features of the 3850 switch is that it allows for the creation of two priority queues. So on this occasion, I placed both  Audio and Video traffic in the first priority queue while placing the VIOP and video signalling traffic in the second priority queue. However, please note that because Video traffic is more burst-y than RTP audio, it is better to place Video traffic in the second priority queue when designing qos for a network where there is an extensive video deployment.

Notice that at the end I just  added the command:  ‘ class call-default’ ? This is the ‘catch-all’ statement that matches any traffic that was not expressly matched by the   class-maps above.

policy-map media_priority
class rtp_audio_and_video
priority level 1 percent 35
class signal
priority level 2 percent 15
class class-default

::::::::::::::::::::::::::::::::::::::::::::::::::::::::::::::::::::::::::::::::::::::::::::::::::::::::::::::::::::::::::::::::::::::::::::::::::::::::::::::::::::::::::::::::::::::::::::::::::::::::::::::::::::::::::::::::

The statement below can then be applied to all trunk interfaces. For trunk-groups/ether-channels, you can add the command in both input and output directions.

service-policy output media_priority

::::::::::::::::::::::::::::::::::::::::::::::::::::::::::::::::::::::::::::::::::::::::::::::::::::::::::::::::::::::::::::::::::::::::::::::::::::::::::::::::::::::::::::::::::::::::::::::::::::::::::::::::::::::::::::::::

The following commands were placed on all the access ports. The first command tells the switch to only accept qos markings from  cisco-phones. However, the Cisco 3850 switch provides for  the ability to trust other devices like ,  Cisco Digital Media Player, Cisco TelePresence System, and  IP Video Surveillance Cameras.

The second line tells the Cisco phone to mark all traffic coming form the connected PC with  a COS value of 0.

One thing that should be noted is that by default, the Cisco 3850 switch will trust all QOS markings coming from attached devices so I would advise on using the ‘ trust device’ statements to lock-down  or prevent rouge devices from marking the QOS  values of their traffic too high.

trust device cisco-phone

switchport priority extend cos 0

service-policy output media_priority

::::::::::::::::::::::::::::::::::::::::::::::::::::::::::::::::::::::::::::::::::::::::::::::::::::::::::::::::::::::::::::::::::::::::::::::::::::::::::::::::::::::::::::::::::::::::::::::::::::::::::::::::::::::::::::::::

Now that we’ve talked about the configurations, let talk about how to check whether the qos is actually working.:

Looking that output below, you will notice that ‘bytes output’ and ‘total drops’ counters. These are the counters that you need to look out for: issue the command every few seconds and see whether the counters  are increasing.

You will also notice that the class-map counters are all zero. Don’t let this alarm you.  The qos is working; Cisco has just done what they do very well which is to get everyone startled. Ignore that part.  If in doubt, apply an aggressive policing  policy to the traffic that you are matching and see everything grind to a halt 🙂

BRAZIL-3850-STK1#show policy-map interface g1/0/1

GigabitEthernet1/0/1

Service-policy output: media_priority

queue stats for all priority classes:

Queueing

priority level 1

(total drops) 0

(bytes output) 893757086

queue stats for all priority classes:

Queueing

priority level 2

(total drops) 0

(bytes output) 34404961

Class-map: rtp_audio_and_video (match-any)

0 packets

Match:  dscp af32 (28) af33 (30) cs4 (32) af41 (34) af42 (36) af43 (38) ef (46)

0 packets, 0 bytes

5 minute rate 0 bps

Match: cos  5

0 packets, 0 bytes

5 minute rate 0 bps

Match: cos  4  5

0 packets, 0 bytes

5 minute rate 0 bps

Priority: 35% (350000 kbps), burst bytes 8750000,

Priority Level: 1

Class-map: signal (match-any)

0 packets

Match:  dscp cs3 (24) af31 (26) af32 (28) af33 (30)

0 packets, 0 bytes

5 minute rate 0 bps

Match: cos  3

0 packets, 0 bytes

5 minute rate 0 bps

Priority: 15% (150000 kbps), burst bytes 3750000,

Priority Level: 2

Class-map: class-default (match-any)

0 packets

Match: any

0 packets, 0 bytes

5 minute rate 0 bps

(total drops) 0

      (bytes output) 2422713863

Did you notice anything  odd about the Class-maps configurations above? Ok let me ask the question: Are those class-maps a ‘ match-any’ or ‘match-all’ statement?

We all know that if an Engineer  does not expressly configure her  class-map with a  ‘ match-any’ statement,  the class-map  will be set to  a ‘ match-all’ statement. But in the 3850 switches; this is not true.  A quick look at the output of the ‘show policy-map interface g1/0/1’ above will prove this.

Hope you find this helpful.

Cheers

Maxwell


* Hint:Please note that some of the screenshots and outputs in this post have been recreated in a lab

* Hint:Please double-click the snapshots to zoom into them. 

This is another interesting case that  I  recently worked on with a colleague of mine.  The topology below represents a high level overview of what the client’s network looks like. The complaint was that users could call local numbers but all international calls were failing to connect.  That got us thinking . . .  our first question was, if local calls are working fine, and international call are not, then what is the difference between both calls

The snap-shot below shows how the sip messages were flowing for the working local calls .
Working call

If you compare the sip messages of the working call above with the non-working international call below, you will see that the difference is that the messages below contains a ‘ 183 session progress message‘.

Failed call

So based on the above, the question that now presents itself is:  why did the Cisco Unified Boarder element send a bye message to the Cisco Call Manager when the remote phone that is out in the cloud was actually ringing? Does this make sense;  Strange isn’t it?

Ok so we know from our experience as Engineers  that when a call fails,  there is normally some sort of error message, failure or cause code of some sort. In the trace output below, you will see that I have actually highlighted the error -code that was in the  ‘ bye‘ message that we saw in the call-flow diagram above.

As we can see,  the sip protocol informs us that the call failed with  a cause of: ‘Reason: Q.850;cause=65‘ . If you do a Google search for cause code 65 will probably find something related to a codec/capability  negotiation issue; which might lead one to think about transcoding. Please have a try for yourself; do a Google search and see what you come up with.

::::::::::::::::::::::::::::::::::::::::::::::::

Sent:
BYE sip:447578332431@192.168.0.10:5060 SIP/2.0
Via: SIP/2.0/UDP 192.168.0.20.8:5060;branch=z9hG4bK8052F20C7
From: <sip:00412256731@192.168.0.20>;tag=FAA7C024-667
To: “maxwell o” <sip:447578332431@192.168.0.10>;tag=342693~12b9673c-9ebc-4b8c-b0db-46b8d985386a-34835506
Date: Mon, 30 Sep 2013 12:44:02 gmt
Call-ID: fa88da80-24917212-28046-2212b0a@192.168.0.10
User-Agent: Cisco-SIPGateway/IOS-15.2.4.M1
Max-Forwards: 70
Timestamp: 1380545045
CSeq: 101 BYE
Reason: Q.850;cause=65
P-RTP-Stat: PS=19,OS=4480,PR=25,OR=4000,PL=0,JI=0,LA=0,DU=34270069
Content-Length: 0

::::::::::::::::::::::::::::::::::::::::::::::::

Did you carry out the Google search, did it show something related to codec?  if so, then I’m pleased to inform you that answer is  incorrect 🙂 lol . . . just joking :-). I have been mislead by so many error codes in the past that I no longer trust them completely.

On a more serious note, lets take a look at what RFC: 3262(click on this link) has to say about this; and I quote:

 If the UAS had placed a session description in any reliable
   provisional response that is unacknowledged when the INVITE is
   accepted, the UAS MUST delay sending the 2xx until the provisional
   response is acknowledged.  Otherwise, the reliability of the 1xx
   cannot be guaranteed, and reliability is needed for proper operation
   of the offer/answer exchange.

::::::::::::::::::::::::::::::::::::::::::::::::

So the question is, what does the above mean? Lets start of by explaining what a ‘provisional response’ is:

A very simplified definition of provisional responses is that ‘ they are 1xx responses within a Sip Dialogue/ conversation’. The snap-shot below provides  a quick glance at examples of Provisional Responses.

(source: http://en.wikipedia.org/wiki/List_of_SIP_response_codes#1xx.E2.80.94Provisional_Responses)

1xxreal

However, the definition above still does not explain what a ‘ reliable   provisional response’ is.

As simplified definition of a ‘ reliable provisional response’ is that :    a provisional response becomes reliable when the Sending User Agent Server (UAS) expects an acknowledgement back from the receiving User agent (UA)

With these definitions under out belt, it is now easy to understand what the RFC copied above was trying to say. The RFC is basically pointing out the importance of receiving an acknowledgement from the remote end when the reliable response mechanism is being used. It can actually stop a call from completing if not handled properly.

Lets take a time-out  to quickly take a look  at the SIP-message-flow the copied below. Did you notice the use  of the PRACK?     :

(Source: ‘ borrowed’ form Cisco )

good call flow

I guess at this point, the Sip-call-flow diagram of the failed international  call makes so much more sense now? I guess we can see the cause of the failure now? Basically, the Cisco Unified boarder element sent a bye message to the call-manager because the call manager never sent an ACK message to the ‘183 session progress message‘ it sent to call-manager.

To be honest, this should not have happened though: The Cisco CUBE algorithm was clearly not following the relevant SIP RFC stipulations. But then again who does? I will not explain why the Cisco CUBE was not following RFC stipulations because this post would become too long and boring.

Anyway, here is what we did to solve the problem:

We modified the ‘ sip profile’ attached to the sip trunk so that it would support the sending of RACK ( Provisional Response Acknowledgement)messages to all  Provisional Response messages coming from cube(i.e  18x sip messages).

Here are the steps:

1) go to cucm admin page

2) find the sip profile that your sip trunk is using.

3) then go to device  > device Setting > SIP Profile

4) enable ‘ send PRACK for all 1xx messages

5) reset the sip trunk

6) make sure your sip dial-peer on the cube that is pointing at cucm has something like this in config line:

dial-peer voice 20 voip
  voice-class sip rel1xx require 100rel

Send PRACK

Well as soon as we did this, all the calls started connecting fine.

However, we were having ringing / ring-back issues on international calls such that when an international call was made, the caller could not hear the remote phone ringing.

If you encounter this in your network, here is what you could do resolve it.

On the cucm:

:::::::::::::::::::::::::::::::::::

1) go to cucm admin page

2) find the sip profile that your sip trunk is using.

3) then go to device  > device Setting > SIP Profile

4) tick the check box for ‘ disable early medial for 180’

5) reset the sip trunk

6 on your Cisco Cube you should have a config on your inbound and outbound dial-peer similar to this(if you found that the service provider was not sending the audio or media in 183 /180 message):

dial-peer voice 20 voip
 voice-class sip block 183 sdp absent
voice-class sip block 180 sdp absent (use this single line with care)

see the diagram below for further details .   .    .

local ringback

Hope you have found this entry entertaining and contributory to your quest for knowledge and your day-to-day battles between Man and Machine.

A special thank you goes out  Mike Jones for his contributions to this case which has now led to this publication.

Mike can be found at uk.linkedin.com/pub/michael-cunliffe-jones/46/6b6/2a6/

All the best folks,

Regards

Maxwell


:::::::::::::::::::::::::::::::::::::::::::::::::::::::::::::::::::::::::::::::::::::::::::

Catalyst 6509  Configuration sample

:::::::::::::::::::::::::::::::::::::::::::::::::::::::::::::::::::::::::::::::::::::::::::

Thanks for dropping by again.  I have now added   this configuration sample as a follow up to  ‘ part one’ of this particular post.    This sample was applied a  Cisco 6509 switch stationed in a collapsed core. For clarity, I divided the configurations into three parts.

::::::::::::::::::::::::::::::::::::::::::::::::::

Egress Queuing Configurations

::::::::::::::::::::::::::::::::::::::::::::::::::

policy-map type lan-queuing Egress_1p3q8t
class cos_5
priority
class cos_6_&_7
bandwidth remaining percent 20
queue-buffers ratio 15
random-detect cos-based
random-detect cos 6 percent 98 100
random-detect cos 7 percent 98 100
class cos_2_3_&_4
bandwidth remaining percent 15
queue-buffers ratio 25
random-detect cos-based
random-detect cos 2 percent 80 90
random-detect cos 3 percent 90 100
random-detect cos 4 percent 90 100
class class-default
bandwidth remaining percent 35
queue-buffers ratio 40
random-detect cos-based
random-detect cos 0 percent 70 100
random-detect cos 1 percent 40 70

::::::::::::::::::::::::::::::::::::::::::::::::::::::::::::::::::::::::::::::::::::::::::::::::::::::::::::::::::::::::::::::::::::::::::::::::::::::::::::::::::::::::::::::::::::::::::::::::::::::::::::::::::::::::::::::::

::::::::::::::::::::::::::::::::::::::::::::::::::::::::::::::::

Ingress Queuing Configurations

::::::::::::::::::::::::::::::::::::::::::::::::::::::::::::::::

policy-map type lan-queuing Ingress_2q8t
class cos_5
bandwidth percent 30
queue-buffers ratio 10
queue-limit cos 5 percent 100
class class-default
bandwidth percent 70
queue-buffers ratio 50
queue-limit cos 1 percent 65
queue-limit cos 2 percent 65
queue-limit cos 0 percent 75
queue-limit cos 4 percent 80
queue-limit cos 3 percent 90
queue-limit cos 6 percent 100
queue-limit cos 7 percent 100

:::::::::::::::::::::::::::::::::::::::::::::::::::::::::::::::::::::::::::::::::::::::::::::::::::::::::::::::::::::::::::::::::::::::::::::::::::::::::::::::::::::::::::::::::::::::::::::::::::::::::::::::::::

These Configurations were applied to every trunk port  to other switches and also to switch-ports connected to Unified Communications servers:

platform qos trust dscp

Service-policy type lan-queuing output Egress_1p3q8t

service-policy type lan-queuing input Ingress_2q8t


Hope you’ve found this useful.

Thanks for dropping by.  


:::::::::::::::::::::::::::::::::::::::::::::::::::::::::::::::::::::::::::::::::::::::::::

Catalyst 3750 Configuration samples 

:::::::::::::::::::::::::::::::::::::::::::::::::::::::::::::::::::::::::::::::::::::::::::

Over the past few weeks, I have been working on a number of quality-of-service (Qos) design and deployment projects so I  thought I’d just spend some time to blog about it since I loved it so much.   In the next few weeks, I will add new entries to this blog for each of the three switch models listed above. Today I will be focusing on the Catalyst 3750.

The Sample configurations below were designed to meet the needs of a branch office comprising of over 500 users.  I will not disclose the nature of the client’s business but it’s sufficient  to say that they generate a massive amount of telephone calls per day.  The client complained that the plague of bad call quality was never too far away from them. They were frustrated by the fact that they could hardly hear the people on the other side of the line and sometimes, the calls would just drop off mid-conversation.

The configurations below is a sample of one of  the configurations that I designed and deployed somewhere in the globe.  I have not added explanations for each configuration line because I thought I’d simply allow anyone to ask a question if they needed more explanation. The intention is to provide a sample config that could possibly be of use to someone out there.

::::::::::::::::::::::::::::::::::::::::::::::::::

Design Considerations:

::::::::::::::::::::::::::::::::::::::::::::::::::

This configuration was designed to optimize a network that generates 30% Voip  traffic whilst the remaining is bulk data.  This solution is currently  working perfectly in  an extremely busy network.

::::::::::::::::::::::::::::::::::::::::::::::::::::::::::::::::::::::::::::::::::::::::::::::::::::::::::::::::::::::::::::::::::::::::::::::::::::::::::::::::::::::::::::::::::::::::::::::::::::::::::::::::::::::::::::::::

mls qos

mls qos srr-queue input priority-queue 2 bandwidth 30
mls qos map cos-dscp 0 8 16 24 32 46 48 56
mls qos srr-queue input bandwidth 70 30
mls qos srr-queue input threshold 1 75 90
mls qos srr-queue input threshold 2 90 100
mls qos srr-queue input buffers 85 15

mls qos srr-queue input cos-map queue 1 threshold 1 0 1 2
mls qos srr-queue input cos-map queue 1 threshold 2 3
mls qos srr-queue input cos-map queue 1 threshold 3  6 7
mls qos srr-queue input cos-map queue 2 threshold 2 4

mls qos srr-queue input cos-map queue 2 threshold 3  5

mls qos srr-queue input dscp-map queue 1 threshold 1 0 8 10  12  14 16 18 38

mls qos srr-queue input dscp-map queue 1 threshold 1 20 22 26 28 30 34 36

mls qos srr-queue input dscp-map queue 1 threshold 2 24
mls qos srr-queue input dscp-map queue 1 threshold 3 48 56

mls qos srr-queue input dscp-map queue 2 threshold 2 40 32

mls qos srr-queue input dscp-map queue 2 threshold 3 46

mls qos srr-queue output cos-map queue 1 threshold 3  5

mls qos srr-queue output cos-map queue 1 threshold 2 4
mls qos srr-queue output cos-map queue 2 threshold 3 6 7

mls qos srr-queue output cos-map queue 2 threshold 2 1 2

mls qos srr-queue output cos-map queue 3 threshold 3 3

mls qos srr-queue output cos-map queue 4 threshold 3 0

mls qos srr-queue output dscp-map queue 1 threshold 3 46 40 32

mls qos srr-queue output dscp-map queue 2 threshold 3 48 56

mls qos srr-queue output dscp-map queue 2 threshold 2 8 10 12 14 16 18 20 22

mls qos srr-queue output dscp-map queue 2 threshold 2 26 28 30 34 36 38

mls qos srr-queue output dscp-map queue 3 threshold 3 24

mls qos srr-queue output dscp-map queue 4 threshold 3 0
mls qos queue-set output 1 threshold 1 85 90 100 100
mls qos queue-set output 1 threshold 2 80 90 100 400
mls qos queue-set output 1 threshold 3 100 100 100 100
mls qos queue-set output 1 threshold 4 130 140 100 400
mls qos queue-set output 2 threshold 1 149 149 100 149
mls qos queue-set output 2 threshold 2 118 118 100 235
mls qos queue-set output 2 threshold 3 41 68 100 272
mls qos queue-set output 2 threshold 4 42 72 100 242

mls qos queue-set output 1 buffers 10 20 10 60
mls qos queue-set output 2 buffers 16 6 17 61

::::::::::::::::::::::::::::::::::::::::::::::::::::::::::::::::

These Configuration were applied to every switch-port that was connected to a Cisco phone:

mls qos trust cos

switchport priority extend cos 0

mls qos trust device cisco-phone

priority-queue out

srr-queue bandwidth share 30 15 10 45

queue-set 1

:::::::::::::::::::::::::::::::::::::::::::::::::::::::::::::::::::::::::::::::

These Configuration were applied to every trunk port.

mls qos trust cos

priority-queue out

srr-queue bandwidth share 30 15 10 45

::::::::::::::::::::::::::::::::::::::::::::::::::::::::::::::::::::::::::::::::::::::

Hope you’ve found this useful.

Thanks for dropping by.  


* Hint:Please note that some of the screenshots and outputs in this post have been recreated in a lab

* Hint:Please double-click the snapshots to zoom into them. 

This is one of the most intriguing cases I have every dealt with:   This client has Cisco Unity connection 8.6x integrated with a Microsoft Forest containing  over ten Microsoft server 2003 and 2008 domains controllers spread out across multiple sites in Europe and the Americas.

The client complained that all of a sudden, when new users were created in Active directory, they would no longer show up in Cisco unity connection . I asked the client what had  changed prior to the problem and I was informed that nobody had touched the Cisco servers except for  the fact that their Group policies had been recently been re-written within active-directory.

I logged unto Cisco unity connection and tried do an import of users and nothing happened; no error messages were displayed on the webpage and no  newly created users from Active-Directory were imported.

I made up my mind that I would have to  pull out the ‘ Big-Guns’:

Stage one 

1)    I Installed Wireshark on a  PC and started capturing packets

Stage Two

On the same  PC, I also installed Softerra LDAP Browser. softerra LDAP Browser is a tool that you simple put the username, password and  IP-address of your LDAP server into and it will show you everything in your Domain. This was going to be the way that I would use to simply test the username and password that Cisco unity connection was using.   If you need this tool, here is the link to it: http://www.ldapbrowser.com/download.htm

Here is snapshot  of the tool in action:

LDAP-Browser

Stage Three

After I entered the username,password and IP-address of the LDAP server, I started seeing errors in the Wireshark. Here is a screen-shot of the errors below:

LDAP bind failure

The username and password that I was using to authenticated was the same one that the Cisco unit Connection server was using so from the wireshark capture, it was clear that the reason the unity connection server was unable to import users from Active Directory was because it did not even make it pass authentication let-alone pulling user database.

If you look at the error message in the capture above, it say: ‘ In order to perform this operation, a successful bind must be completed on the connection’  

The term ‘bind’ means authentication. So in ordinary English, the error message that can be seen in the LDAP message coming back from the LDAP server  is basically saying: in order to search the LDAP user database, you must first authenticate successfully.

I double checked with  the ‘DirSync’ service traces on unity connection and I found exactly the same error message.

Stage Four

With this evidence, I told the client to speak to his Server team; who in tern, contacted Microsoft Directly. Shortly after the Microsoft team arrived on the scene, they informed me that they did not share my view that the problem was on the Microsoft server side.  They stated that since other  users and servers were authenticating against LDAP without any problems, the LDAP server was fine.

Stage Five:

I knew I was talking to skilled and experienced Engineers so I was not quick to doubt them. I pulled out my wireshark again and investigated how the other non-cisco servers were managing to authenticate without any problems. what I found was that Cisco Unity Connection was using a method of authentication called ‘ Simple Bind‘ while the other servers were not.  Simple bind authentication method is when  usernames and passwords are sent in clear text: I will share how I got to know this later in this post.

I went back to Microsoft and informed them that they  needed to permit simple bind for the Cisco Unity Connection server because that is how Unity connection operates. And that if they wanted security, they would have to use ‘ transport-Layer-security (TLS)’ because that is what Unity Connection supports.

Stage Six: 

In order to test my theory, Microsoft then decided to enable Anonymous Bind for test purposes only. Anonymous bind is when a client can authenticate to the server without username or password.


Stage Seven

After we made the change above, the Cisco unity Connection still could not import users from Microsoft Active directory. Again, the Microsoft Team told me that they did not share my view . However, I reminded them that  I  asked for ‘simple bind’ to be allowed on the network not ‘ anonymous bind’ so they continued to work with me.

I was really starting to look really  bad.  I pulled out wireshark again and captured the packets being exchanged between the Cisco Unity Connection server and Microsoft LDAP Server and noticed that something had changed since anonymous bind was allowed;  this is what I found:

LDAP_no such object.

Here is the interpretation of the logs above:

1)  In the very first line, we see that Cisco Unity Connection server at Ip-address 172.16.6.33 sends an LDAP simple bind request to the LDAP server at IP-address  172.16.6.5. We know that we are using simple bind authentication because can see the word ‘ simple‘ at the very end of the line.

2)  Looking at the ‘ source’ and ‘destination’  fields In the second line of the capture, we can see that the LDAP server sends a message back to the unity connection server stating that authentication had successfully completed.

3)  In the third line, we see  the Unity connection server trying to find all the users in the database by sending a search request to the LDAP sever and in the fourth line we see that the server responds with a result of zero; meaning that no result was provided to the Cisco unity connection server.

4)  Going further down the line, we see that the unity connection server continues trying until the 20th line when the LdAP Server responds back with NameErr  0000208D, Problem 2001 (No_object)

Stage Eight

I decided to collect traces  from Unity Connection  so I turned on detailed traces, performed a full LDAP system sync on unity connection and collected Cisco Dir-sync service traces from the unity connection server. Here is what I  found:

DAPSync(cca4b920-9361-9535-8d80-ece481332007)[getInvocationId] caught exception … [LDAP: error code 32 – 0000208D: NameErr: DSID-03151F00, problem 2001 (NO_OBJECT)

 According to the following Microsoft website, LDAP error code 32 means:  ‘The user has insufficient access rights: http://support.microsoft.com/kb/218185

Stage nine

I Informed  the Server Admins and  Microsoft team about the new error messages I was getting from their Microsoft servers.  I asked the team to explain why their server was not happy with my request since the account I was using to authenticate was an admin user. In response, they informed me that the server was treating my Simple bind Request as an Anonymous bind request and since Anonymous bind request were not permitted to search the database, my request were being dropped.  To remedy this, the following steps were applied to the Domain Controller.

  1. Open regedit.exe on a domain controller
  2. Go to HKEY_LOCAL_MACHINE\System\CurrentControlSet\Control\SecurityProviders
  3. In the right window pane double-click on SecurityProviders
  4. Add pwdssp.dll to the end of the Value data field which should be separated by a comma after the last entry.  For example:

msapsspc.dll, schannel.dll, digest.dll, msnsspc.dll, pwdssp.dll

5.  Reboot the DC: This was done on all the domain controllers on Windows 2008 and above and a reboot was required

Stage Ten

After the changes above were applied, everything started working fine  lol 🙂 . . . and all along, everyone was blaming me but thanks to wireshark, I was able to prove to the remote Microsoft Server team that the problem was from them.  Long live Wireshark. 🙂 and Mr Remi A @silvercleric for his contribution to this case.


A while back it occurred to me that the best  Unified Communications Engineers  are the ones that  best understand the language of ‘ machines’ .  The truth is, when a device develops a problem, it will try to tell you in its own way using its own language. Just as in any other form of interaction; success is rare in the absence of  being able to give expression to one’s wishes and also being able to listen. An Engineer speaks the language when he issues commands to a device using a ‘ graphical user interface’ or a  ‘ command line interface’ . An Engineer interprets/understands  the  language of machines when he is able to decipher  trace and  error logs.

So, I made up my mind that where possible, I would try to  listen first:  I decided to  look for the root causes of a problem by first taking a look at the traces and logs  before double checking the  configurations. The aim of this is simply geared towards improving my ability to understand what these devices are trying to tell me in logs and traces when something goes wrong. practice makes perfect!

I suspect someone out there shares my view that understanding logs and traces is what completes an Engineer so I am going to share this little episode  that occurred in my home lab recently.

So  a few days ago I took my personal router and switch with me to a data-center where I was carrying out a server rebuild. I had modified the configurations on my devices to replicate the client’s network but for some reason, when I got home  to do some practice labs, I was almost surprised that my MGCP gateway would not   register to my Call Manager.

It was time to explore machine language so I logged unto the voice gateway and issued the following commands:

1) Debug mgcp packets

2) Terminal monitor

3) On the call-manager, I enabled detailed traces for voice gateways and MGCP.

4)  Lastly, from the voice gateway’s global configuration  interface, I issued the commands ‘ no mgcp’ following by ‘ mgcp’ . By so doing, I was essentially restarting the MGCP process.

Here is what I saw happening on the gateway:

*Jul 6 11:23:29.324: MGCP Packet sent to 192.168.0.55:2427—>
RSIP 205478228 *@Router.homelab.com MGCP 0.1
RM: restart
<—

*Jul 6 11:23:29.332: MGCP Packet received from 192.168.0.55:2427—>
200 205478228
<—

*Jul 6 11:23:29.332: MGCP Packet received from 192.168.0.55:2427—>
AUEP 31 S0/SU3/DS1-0/1@Router.homelab.com MGCP 0.1
F: X, A, I
<—

:::::::::::::::::::::::::::::::::::::::::::::::::::::::::::::::::::::::::::::::::::::::::::::::::::::::::::::::

In the above, we see that the process started of by the gateway (10.10.10.3) sending a RSIP ‘ Restart in progress’ message to the call-manager(192.168.0.55).

Next, we see a ‘200‘ acknowledgment  message from the Cisco call manager basically saying: ‘ I’m ok with that; thanks for letting me know’ .

Next we see an ‘Audit end point’  message (AUEP) from the call-manager asking the gateway to  provide it with a report of the current status of the ISDN trunk. The call manager is very specific because it was asking for an Audit of interface ‘S0/SU3/DS1-0/1@Router.homelab.com‘.  In human language, that means:  give me a report of the first channel (DS1-0/1) of  interface 0/3/0 at a router which has a qualified domain name of Router.homelab.com.

So far, this is normal behavior. You can double check with the  Cisco Link below which shows the registration process in graphical format.

http://www.cisco.com/en/US/tech/tk1077/technologies_tech_note09186a00801da84e.shtml#t6

:::::::::::::::::::::::::::::::::::::::::::::::::::::::::::::::::::::::::::::::::::::::::::::::::::::::::::::::

*Jul 6 11:23:29.336: MGCP Packet sent to 192.168.0.55:2427—>
500 31 Endpt Unknown
<—

*Jul 6 11:23:29.336: MGCP Packet received from 192.168.0.55:2427—>
AUEP 32 S0/SU3/DS1-0/2@Router.homelab.com MGCP 0.1
F: X, A, I
<—

*Jul 6 11:23:29.336: MGCP Packet sent to 192.168.0.55:2427—>
500 32 Endpt Unknown
<—

:::::::::::::::::::::::::::::::::::::::::::::::::::::::::::::::::::::::::::::::::::::::::::::::::::::::::::::::

In the first line above, we see that the voice gateway responded to the call-manager’s ‘Audit endpoint’ request with a ‘500’ endpoint unknown response.

In the next two lines, we see that the call-manager tries to ask the gateway the same question about the second  channel (DS1-0/2)on of the ISDN trunk but   once again, the gateway tells the call-manager that it does not know what it’s talking about.

In case you have not understand how to spot  the channel that an audit is being requeted for, take a look at the output below. I think it will make everything sink in:

Router# sh mgcp endpoint

Interface E1 0/3/0

ENDPOINT-NAME V-PORT SIG-TYPE ADMIN
S0/SU3/ds1-0/1@Router 0/3/0:15 none up
S0/SU3/ds1-0/2@Router 0/3/0:15 none up
S0/SU3/ds1-0/3@Router 0/3/0:15 none up

:::::::::::::::::::::::::::::::::::::::::::::::::::::::::::::::::::::::::::::::::::::::::::::::::::::::::::::::

So at this point I already knew why my gateway was not registering  but I was curious about seeing how the call-manager would try to express the problem to me so I  collected call-manager traces and this is what I saw:

:::::::::::::::::::::::::::::::::::::::::::::::::::::::::::::::::::::::::::::::::::::::::::::::::::::::::::::::

|MGCPHandler received msg from: 10.10.10.3
RSIP 205478228 *@Router.homelab.com MGCP 0.1
RM: restart

:::::::::::::::::::::::::::::::::::::::::::::::::::::::::::::::::::::::::::::::::::::::::::::::::::::::::::::::

From the above we see that the call-manager received a  restart in progress(RSIP) message from the voice-gateway ‘Router.homelab.com’ which is at IP Adress 10.10.10.3.

:::::::::::::::::::::::::::::::::::::::::::::::::::::::::::::::::::::::::::::::::::::::::::::::::::::::::::::::

In the logs below,  we see the ‘MGCP manager’; which is running on the call-manager, scrambling to figure out who device ‘Router.homelab.com ‘ is by querying the call-manager database.  In the second line below, we see that call-manager believes that the gateway is using a protocol of ‘ PRI Euro’ which runs on E1. 

:::::::::::::::::::::::::::::::::::::::::::::::::::::::::::::::::::::::::::::::::::::::::::::::::::::::::::::::

|MGCPManager::loadDbMGCPDeviceDigitalAccessPriMatchFunc – found GwName(S0/SU3/DS1-0@Router.homelab.com

MGCPpn9d – Started. Device = S0/SU3/DS1-0@Router.homelab.com, Protocol=PRI EURO, Side = USER.

::::::::::::::::::::::::::::::::::::::::::::::::::::::::::::::::::::::::::::::::::::::::::::::::::::::::::::::::

In the first and second line below, we see the traces confirming that the ISDN layer three  Backhaul link from the gateway to the call-manager is opened.

In the fourth line, we see that the call-manager determines that this is an MGCP trunk because the model type is 121 (MODEL TYPE = 121)

:::::::::::::::::::::::::::::::::::::::::::::::::::::::::::::::::::::::::::::::::::::::::::::::::::::::::::::::

|MGCPBhHandler 10.10.10.3 – TCP opened and BH registered for the device

MGCPpn9d – Backhaul link OPEN for Devicename S0/SU3/DS1-0@Router.homelab.com

MGCPHandler send msg SUCCESSFULLY to: 10.10.10.3

MGCPpn9d: dn_discovery_DbDnRes – DEVICE NAME = S0/SU3/DS1-0@Router.homelab.com MODEL TYPE = 121

::::::::::::::::::::::::::::::::::::::::::::::::::::::::::::::::::::::::::::::::::::::::::::::::::::::::::::::::

Since the call-manager believes that this is an MGCP trunk (MODEL TYPE = 121)running on protocol type PRI EURO,  the call-manager will not request for an audit of a  24 channel  T1 trunk would it? it will request for an audit of a 31 channel E1 trunk that is probably running in Europe or somewhere else that uses the E1 standard.

So naturally, in the second and fourth lines below, we see  call-manager was requesting for an audit (AUED) of the  1st channel (DS1-0/1) and 31st (DS1-0/31) channel respectively. I did not added the audit request for channel 2 to 30 because it was not needed, but as can be seen in the last line of trace, the gateway’s response to every audit request was: ‘ sorry, I don’t know what you are talking about’ (500 31 Endpt Unknown)

:::::::::::::::::::::::::::::::::::::::::::::::::::::::::::::::::::::::::::::::::::::::::::::::::::::::::::::::

|MGCPHandler send msg SUCCESSFULLY to: 10.10.10.3

AUEP 31 S0/SU3/DS1-0/1@Router.homelab.com MGCP 0.1
F: X, A, I

|MGCPHandler send msg SUCCESSFULLY to: 10.10.10.3
AUEP 60 S0/SU3/DS1-0/31@Router.homelab.com MGCP 0.1
F: X, A, I

|MGCPHandler received msg from: 10.10.10.3
500 31 Endpt Unknown

::::::::::::::::::::::::::::::::::::::::::::::::::::::::::::::::::::::::::::::::::::::::::::::::::::::::::::::::

If you recall from the beginning of this post I said that I already knew what was wrong when the voice-gateway responded with the ‘endpoint unknown message’ to the audit  endpoint request  from the call-manager. we are about to see the reason why.

The next thing I did was to turn off all debugging on the voice-gateway by using the command: ‘ u all’ at configuration mode. However, I still had terminal monitor on.

I then logged unto the Cisco Communications Manager webpage and reset my gateway from there. I went back to the voice-gateway and this is the shortened version of what I saw:

::::::::::::::::::::::::::::::::::::::::::::::::::::::::::::::::::::::::::::::::::::::::::::::::::::::::::::::::

*Jul  6 14:23:32.884: %SYS-5-CONFIG_I: Configured from console by console

controller E1 0/3/0
^
% Invalid input detected at^‘ marker.

pri-group timeslots 1-31 service mgcp
^
% Invalid input detected at ‘^‘ marker.

::::::::::::::::::::::::::::::::::::::::::::::::::::::::::::::::::::::::::::::::::::::::::::::::::::::::::::::::

Do you know what’s happening above?  Basically, because I had reset the voice-gateway on call-manager, a signal was sent to the voice-gateway that it should reboot the trunk and download a new set of configurations.

The gateway clearly download the new configuration because the gateway was actually trying to configure the E1 port as can be seen  in the second line of the trace output above. However, we see that the router return an error of ‘ invalid input detected.  This means that this command is not allowed.  But the question is why?   . . . lets find out.

So on the voice gateway I issued the commands ‘do sh run | in controller ‘ and ‘do sh run | in card ‘:

::::::::::::::::::::::::::::::::::::::::::::::::::::::::::::::::::::::::::::::::::::::::::::::::::::::::::::::::

Router(config)#do sh run | in controller
controller T1 0/3/0

Router(config)#do sh run | in card type
card type t1 0 3
voice-card 0

::::::::::::::::::::::::::::::::::::::::::::::::::::::::::::::::::::::::::::::::::::::::::::::::::::::::::::::::

So from the above we can clearly see what the problem was. The Call-manager was trying to configure an E1 interface but there was no E1 interfaces on the gateway just T1.   So all along, the call manager was trying to take audit for an E1 interface that did not exist and the gateway could not register it’s MGCP ports because they were not configured as T1 on the call-manager.  Here is what I did to resolve it:

Router(config)#no card type t1 0 3

Router(config)# card type E1 0 3

Router(config)# reload

Then I reset the gateway on call-manager and everything worked perfectly.   I really hope someone has found this informative because my original thought was that this case is not blog-worthy. However, since the main focus was on understanding traces and becoming more familiar with them, I hope a greater understanding of traces  has been delivered to the readers of this post.

Cheers

Maxwell


 * Hint:Please note that some of the outputs in this post have been recreated in a lab

So on this particular issue, my task was to investigate why, even though there were multiple call-managers in the cluster,  all   external incoming  calls failed to connect to the call-manager cluster whenever the primary call-routing  call-manager server was unreachable. We noticed that   even though there were other call-managers in the cluster that could handle  calls  coming from  the PSTN or service provider, the calls would always fail just because one server was unreachable.  Let me show you a quick diagram of the topology below.

::::::::::::::::::::::::::::::::::::::::::::::::::::::::::::::::::::::::::::::::::::::::::::::::::::::::::::::::::::::::::::::::::::::::::::::::::::::::::::::::::::::::::::::::

Internal phone <———- Call Manager <—(SipTrunk)–<—  2811 Voice Gateway<—-(ISDN Tunk)——-<—Telco or Service provider

::::::::::::::::::::::::::::::::::::::::::::::::::::::::::::::::::::::::::::::::::::::::::::::::::::::::::::::::::::::::::::::::::::::::::::::::::::::::::::::::::::::::::::::::

As the voice gateway is the first point of entry into the network, I started my investigation from there. Here are the related configurations that I found on the voice-gateway.

::::::::::::::::::::::::::::::::::::::::::::::::::::::::::::::::::::::::::::::::::::::::::::::::::::::::::::::::::::::::::::::::::::::::::::::::::::::::::::::::::::::::::::::::


dial-peer voice 1 pots

description  incoming dial-peer for pots leg
incoming called-number .
direct-inward-dial

:::::::::::::::::::::::::::::::::::::::::

dial-peer voice 5 voip
description primary dial-peer to cluster
destination-pattern ^1…$
session protocol sipv2
session target ipv4:192.168.0.99
incoming called-number .
dtmf-relay sip-kpml

:::::::::::::::::::::::::::::::::::::::::

dial-peer voice 3 voip
preference 1
description secondary dial-peer to cluster
destination-pattern ^1…$
session protocol sipv2
session target ipv4:192.168.0.55
incoming called-number .
dtmf-relay sip-kpml

:::::::::::::::::::::::::::::::::::::::::

sip-ua
timers trying 1000

::::::::::::::::::::::::::::::::::::::::::::::::::::::::::::::::::::::::::::::::::::::::::::::::::::::::::::::::::::::::::::::::::::::::::::::::::::::::::::::::::::::::::::::::

  So based on the above configuration, I could tell that the intention was that  if a call came into  the gateway from the PSTN,  it would be routed by  dial-peer 5 to the call-manager server at  ip-address 192.168.0.99 – and if no response was gotten from that server, the call  would  be re-routed by dial-peer 3 which is pointing to another server in the cluster.

However, this was not working as expected  so I decided to enable  sip debugging (debug ccsip messages) and  also ISDN debugging (debug isdn q931 ) . After this, I made sure  that the primary call-manager was unreachable and then I  placed a test call into the cluster. This is what I saw in the debugs .

 ::::::::::::::::::::::::::::::::::::::::::::::::::::::::::::::::::::::::::::::::::::::::::::::::::::::::::::::::::::::::::::::::::::::::::::::::::::::::::::::::::::::::::::::::

An  ISDN setup message is received from the service provider. The calling number is 5555 and the called number is 1007.

:::::::::::::::::::::::::::::::::::::::::::

*Jun 13 20:55:56.528: ISDN Se0/3/0:23 Q931: RX <- SETUP pd = 8 callref = 0x0081
Bearer Capability i = 0x8090A2
Standard = CCITT
Transfer Capability = Speech
Transfer Mode = Circuit
Transfer Rate = 64 kbit/s
Channel ID i = 0xA98381
Exclusive, Channel 1
Progress Ind i = 0x8183 – Origination address is non-ISDN
Calling Party Number i = 0x2180, ‘5555
Plan:ISDN, Type:National
Called Party Number i = 0xA1, ‘1007
Plan:ISDN, Type:National

 ::::::::::::::::::::::::::::::::::::::::::::::::::::::::::::::::::::::::::::::::::::

The voice gateway then tries to connect the call to the call-manager at 192.168.0.99 and because I had made sure that the primary server was unreachable, obviously there would be no response from the call-manager.

::::::::::::::::::::::::::::::::::::::::::::::::::::::::::::::::::::::::::::::::::::::::::::::::::::::::::

INVITE sip:1007@192.168.0.99:5060 SIP/2.0
Via: SIP/2.0/UDP 10.10.10.3:5060;branch=
Remote-Party-ID: <sip:5555@10.10.10.3>;party=calling;screen=no;privacy=off

From: <sip:5555@10.10.10.3>;tag=1EBBA8-1ED
To: <sip:1007@192.168.0.99>
Date: Thu, 13 Jun 2013 20:55:57 GMT
Call-ID: 7A5AF3E6-D3A211E2-800D8BCB-56CC18E8@10.10.10.3
Supported: 100rel,timer,resource-priority,replaces,sdp-anat
Min-SE: 1800
Cisco-Guid: 2052580998-3550613986-2147680284-1483238696
User-Agent: Cisco-SIPGateway/IOS-12.x
Allow: INVITE, OPTIONS, BYE, CANCEL, ACK, PRACK, UPDATE, REFER, SUBSCRIBE, NOTIF Y, INFO, REGISTER
CSeq: 101 INVITE
Max-Forwards: 70
Timestamp: 1371156957
Contact: <sip:5555@10.10.10.3:5060>
Expires: 180
Allow-Events: kpml, telephone-event
Content-Type: application/sdp
Content-Disposition: session;handling=required
Content-Length: 232

v=0
o=CiscoSystemsSIP-GW-UserAgent 9433 8425 IN IP4 10.10.10.3
s=SIP Call
c=IN IP4 10.10.10.3
t=0 0
m=audio 19182 RTP/AVP 18 19
c=IN IP4 10.10.10.3
a=rtpmap:18 G729/8000
a=fmtp:18 annexb=no
a=rtpmap:19 CN/8000
a=ptime:20

::::::::::::::::::::::::::::::::::::::::::::::::::::::::::::::::::::::::::::::::::::::::::::::::::::::::::::::::::::::::::::::::::::::::::::::::::::::::::::::::::::::::::::::::


During the trace or debug output collection, I noticed that even though the gateway was not getting a response back from  the primary call-manager, it never used the secondary dial-peer to send a sip invite message to the backup call-manager. It just continued to send the same invite over and over again  to the primary call-manager until the call failed.  And whenever the call failed, I would see the trace output below:

:::::::::::::::::::::::::::::::::::::::::::::::::::::::::::::::::::::::::::::::::::::::::::::::::::::::::

*Jun 13 20:56:06.564: ISDN Se0/3/0:23 Q931: RX <- DISCONNECT pd = 8 callref = 0 x0081
Cause i = 0x82E6 – Recovery on timer expiry

::::::::::::::::::::::::::::::::::::::::::::::::::::::::::::::::::::::::::::::::::::::::::::::::::::::::::::::::::::::::::::::::::::::::::::::::::::::::::::::::::::::::::::::::


So from the above, it is clear that the  call was dropped from the service provider side because the Recovery timer had expired on the ISDN circuit. This basically means that : while the voice gateway was busy continuously sending the same invite messages to the non-responsive call-manager, the ISDN timers expired because the call was not progressing forward because the voice gateway was not able to connect the ISDN call leg to the SIP call leg.

So basically, I needed to stop the gateway from continuously sending invite messages to a server that is never going to respond. I started looking at all the default sip related configurations on the gateway and I found this:

:::::::::::::::::::::::::::::::::::::::::::

Router#show sip-ua retry
SIP UA Retry Values
invite retry count = 6 response retry count = 6
bye retry count = 10 cancel retry count = 10
prack retry count = 10 update retry count = 6
reliable 1xx count = 6 notify retry count = 10
refer retry count = 10 register retry count = 6
info retry count = 6 subscribe retry count = 6
options retry count = 6

:::::::::::::::::::::::::::::::::::::::::::

As soon as I saw the output above, it was clear what the problem was.  As you can see, the sip user agent was configured to send 6 sip invites before  giving up.  And before it was done sending the 6 sip invites,  the ISDN timers from the service provider  had expired so the Cisco voice gateway never got to the point of sending the 6 sip invites before trying to reached the cluster using the secondary dial-peer.

In order to  resolve this problem, I  reduced the ‘Invite retry’  value to 2 so that the gateway would send two sip invites to the primary server and if it was not responding, the call would be forwarded to the secondary server using the secondary dial-peer.

:::::::::::::::::::::::::::::::::::::::::::

Router(config)#sip-ua

Router(config-sip-ua)#retry invite 2

:::::::::::::::::::::::::::::::::::::::::::

After the above configuration was added to the  gateway, I tested everything again and the fail-over worked perfectly.

Hope you’ve enjoyed this entry.

Cheers


* Hint: Please click on the picture(s) in order to maximize it

 * Hint:Please note that some of the screenshots and outputs in this post have been recreated in a lab

So this was an interesting case that landed on my desk from one of our very technical clients who basically use us solely for escalation.   The client has a third party PBX integrated with Cisco Call-manager via multiple SIP  trunks. One of the things that the client uses the PBX for is that when calls come into Cisco Call-manager, it is sent to the PBX where there are operators who answer calls and forward the calls  on if need be.  However, the client noticed that whenever the agents forwarded calls to his phone that is registered on call-manager,  there was always an extra ‘0’ zero in the beginning of the Caller-ID of the calling-number.   The client wanted to know where this extra zero was being added to the number.  The client went on to say that there was always an extra zero on every call regardless of whether the call originated internally or externally.

My shift was coming to an end and there were so many gateways and trunks everywhere that I didn’t even know how the offending calls entered the network. As a result, I felt we would spend more time trying to rummage through Docs or configurations on call-manager as opposed to just  grabbing a few traces and looking at it. With this thought in mind, I placed a test call from my mobile phone into the company and asked the operator to forward my call on to an internal user.

I collected traces from all the servers in the cluster and since I knew the time-of-call, called and calling number, it was easy to find my call in the traces.  Here is what I found:

From  the traces below  we see a back-hauled signal   to   the Call-manager from Ip address 10.x0.xx.9.. This is the originating MGCP  gateway where my call entered the network .

:::::::::::::::::::::::::::::::::::::::::::::::::::::::::::::::::::::::::::::::::::::::::::::::::::::::::::::

05/17/2013 15:27:34.337 CCM|MGCPBhHandler 10.x0.xx.9  – TCP msg available from Device|<CLID::StandAloneCluster><ct::4,100,135,1.808082><IP::10.X0.XX.9 ><LVL::Detailed>

:::::::::::::::::::::::::::::::::::::::::::::::::::::::::::::::::::::::::::::::::::::::::::::::::::::::::::::

After that, the gateway at  10.x0.xx.9  sends  or backhauls the calling number and called number to call-manager

:::::::::::::::::::::::::::::::::::::::::::::::::::::::::::::::::::::::::::::::::::::::::::::::::::::::::::::

05/17/2013 15:27:34.337 CCM|In  Message — PriEuroSetupMsg — Protocol= PriEuroProtocol|

05/17/2013 15:27:34.337 CCM|Ie – Ni2BearerCapabilityIe — IEData= 04 03 90 90 A3 |

05/17/2013 15:27:34.337 CCM|Ie – Q931ChannelIdIe — IEData= 18 03 A9 83 9B |

05/17/2013 15:27:34.338 CCM|Ie – Q931CallingPartyIe — IEData= 6C 0C 21 83 37 38 32 31 31 37 33 31 34 33 |<CLID::StandAloneCluster><

05/17/2013 15:27:34.338 CCM|Ie – Q931CalledPartyIe — IEData= 70 07 81 37 37 33 33 31 31 |<CLID::StandAloneCluster><


:::::::::::::::::::::::::::::::::::::::::::::::::::::::::::::::::::::::::::::::::::::::::::::::::::::::::::::

From the above we can see that the telephone number are written in ASIC  format so 37 37 33 33 31 31  is basically equal to  773311  :

From the above  I was able to confirm that this was my call because:

The calling   number  was  7821173143

The called   number ended with    773311

The apparent incompleteness of the called-number is perfectly normal because the client subscribes to  ‘direct Inward Dial ’ service.

From the below, we see that after the call was received from the gateway,  the call-manager looked at the configured digit-manipulation on the gateway and applied it to the calling and called number. Hence we see that   the incoming-calling-number  was changed from 7821173143 to 07821173143.

In the second line we can see the call-manager announcing the newly ‘globalised’ (globalizeIncomingCgpn)  in-coming-calling number as 07821173143


:::::::::::::::::::::::::::::::::::::::::::::::::::::::::::::::::::::::::::::::::::::::::::::::::::::::::::::

CCM|SPROCPri::globalizeIncomingCgpn – Adding prefix: 0, Digits to strip: 0, Cgpn Transformation CSS: |

05/17/2013 15:27:34.338 CCM|SPROC :: stripAndPrependDigits– The number 7821173143 is prepended with prefix 0, updated number=07821173143|

15:27:34.338 CCM|SPROCPri::globalizeIncomingCgpn – Globalized Cgpn = 07821173143

:::::::::::::::::::::::::::::::::::::::::::::::::::::::::::::::::::::::::::::::::::::::::::::::::::::::::::::

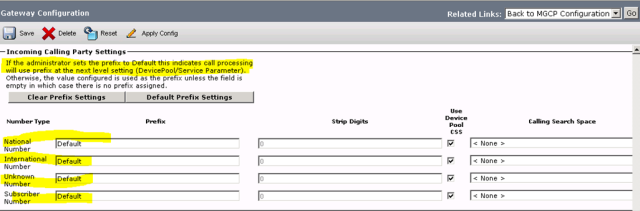
The snapshot below shows the digit manipulation that is configured on the gateway.  Notice that nothing is applied to it? Then why did the trace show that the calling-number had been changed from 7821173143 to 07821173143. well  did you notice that  digit manipulation was set to default?  Default means:  ‘if there is no digit manipulation configurations on the gateway, apply  the digit manipulation that is configurations on the device-pool and if there is nothing  on the device-pool, check the Call-manger Service parameters ’.

GW-mani

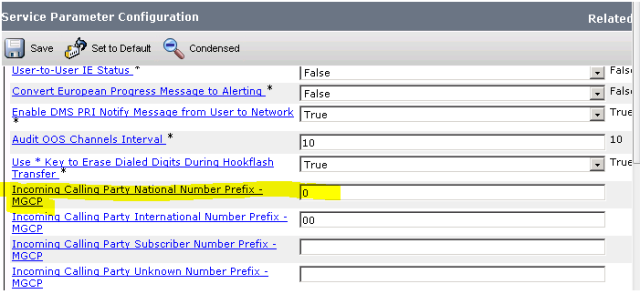
On this occasion, there was also no digit manipulation configured on the gateway so call-manager manipulated the digits based on service parameters. Based on the  service parameter configuration below,  we see that  whenever a  call that is classified as national comes into call-manager, a extra leading Zero (0) is added to the number.

service parameter

The next thing that the call-manger  has to do is to find a route to the destination number of 773311 so it invokes digit analysis by triggering a digit analysis request (daReq).

:::::::::::::::::::::::::::::::::::::::::::::::::::::::::::::::::::::::::::::::::::::::::::::::::::::::::::::

05/17/2013 15:27:34.343 CCM|Digit Analysis: wait_DaReq: daReq.

CCM|Digit analysis: match(pi=”2″, fqcn=””, cn=”07821173143“, , dd=”773311


:::::::::::::::::::::::::::::::::::::::::::::::::::::::::::::::::::::::::::::::::::::::::::::::::::::::::::::

From the trace below we find that the call-manager has found the a match for 773311

:::::::::::::::::::::::::::::::::::::::::::::::::::::::::::::::::::::::::::::::::::::::::::::::::::::::::::::


05/17/2013 15:27:34.343 CCM|Digit analysis: match(pi=”2″, fqcn=””, cn=”07821173143″,dd=”773311

:::::::::::::::::::::::::::::::::::::::::::::::::::::::::::::::::::::::::::::::::::::::::::::::::::::::::::::

Now  call-manager needs to  process the call according to the match.  In the trace below, we  notice the following:

1)      That the match is located at partition called  ‘GW-INCOMING’

2)      That  called number was changed from 773311 to 3311.

 :::::::::::::::::::::::::::::::::::::::::::::::::::::::::::::::::::::::::::::::::::::::::::::::::::::::::::::


05/17/2013 15:27:34.343 CCM|Digit analysis: analysis results|<CLID::StandAloneCluster><

05/17/2013 15:27:34.344 CCM||PretransformCallFingPartyNumber=07821173143

|CallingPartyNumber=07821173143

|DialingPartition=GW-INCOMING

|DialingPattern=3311

|FullyQualifiedCalledPartyNumber=3311

:::::::::::::::::::::::::::::::::::::::::::::::::::::::::::::::::::::::::::::::::::::::::::::::::::::::::::::

After noticing  that the called-number had been changed,  I jumped on call-manager to confirm what happened  in the traces as it was now clear that a digit manipulation had just taken place because 773311  had just changed to  3311 . So I searched  call-manager for the pattern that was just matched and I found a translation-pattern.

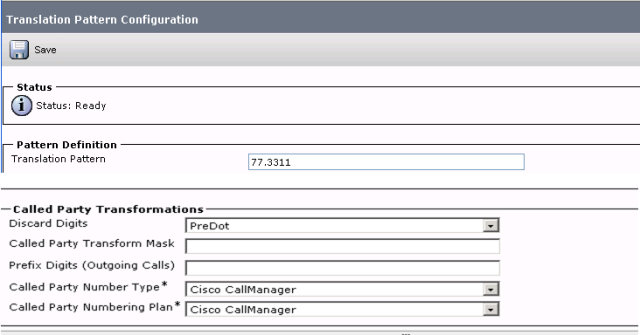
From the screenshot below, we can confirm that the dialed number matched the translation patter ‘77.3311’. We also see that the reason why the digit changed to 3311 was because the digit manipulated that was configured on the translation-pattern was configured to drop all the digits  before 3311


 Translationpatt


Once again call manager tries to get the call to the intended destination by running the new called-number of 3311 through the digit analysis process and in the progress, call manager discovers that number  has a Call-forward-all  (cfa) value of   7165871 configured

:::::::::::::::::::::::::::::::::::::::::::::::::::::::::::::::::::::::::::::::::::::::::::::::::::::::::::::

callKey= 0x37D0D,

ssKey = 0, recordStatus 0,

 dnPattern =  3311, dnPartition =

cfa     = 7165871, cfaToVM     = 0, cfaCss     = PA

cfb     = , cfbToVM     = 0, cfbCss     = PA

cfna    = , cfnaToVM    =

cfur    = 7165871, cfurToVM

cfurInt = 7165871, cfurI

:::::::::::::::::::::::::::::::::::::::::::::::::::::::::::::::::::::::::::::::::::::::::::::::::::::::::::::

So based on the above, our Called or dialed number has just changed from 3311 to 7165871 because it had a (cfa) call-forward-all configured with a value of 7165871.

Therefore, call manager tried to forward the call by first of all carrying out a digit analysis in order to find a match or route.

:::::::::::::::::::::::::::::::::::::::::::::::::::::::::::::::::::::::::::::::::::::::::::::::::::::::::::::

5/17/2013 15:27:34.348 CCM|Forwarding – initiateCFA – CFA, callKey= 0x37D0D|

05/17/2013 15:27:34.350 CCM|Digit analysis: match(pi=”1″, fqcn=””, cn=”07821173143“,dd=”7165871

As can be seen below,   call-manager finds a match for the number it was looking for.

05/17/2013 15:27:34.350 CCM|Digit analysis: match(pi=”1″, fqcn=””, cn=”07821173143, dd=”7165871

:::::::::::::::::::::::::::::::::::::::::::::::::::::::::::::::::::::::::::::::::::::::::::::::::::::::::::::


Now  let’s see what matches  the call-manager found below.

:::::::::::::::::::::::::::::::::::::::::::::::::::::::::::::::::::::::::::::::::::::::::::::::::::::::::::::

|CallingPartyNumber=007821173143

|DialingPartition=SIP-Internal

|DialingPattern=716.XXXX

|FullyQualifiedCalledPartyNumber=7165871

|PotentialMatches=NoPotentialMatchesExist

|PretransformDigitString=7165871

|PretransformPositionalMatchList=716:5871

|CollectedDigits=5871

:::::::::::::::::::::::::::::::::::::::::::::::::::::::::::::::::::::::::::::::::::::::::::::::::::::::::::::

From the above, we can see that while call-manager was trying to find out how to get to 7165871 by finding something that matched it, it found pattern 716.XXXX in partition ‘SIP-Internal ’.

Hello!? Did you notice that the calling number has changed from   07821173143’ to ‘007821173143’ ? if you didn’t  take another look above


If you did then that is good. AS soon as I noticed this,  I wanted to confirm what I had just seen in the logs above  so I logged unto call manager web page  and searched for 716.XXXX.  The number was configured as a route-pattern but there was more to it: check out the  screenshot of the configuration below


routpatterntoproutpatternbuttom 

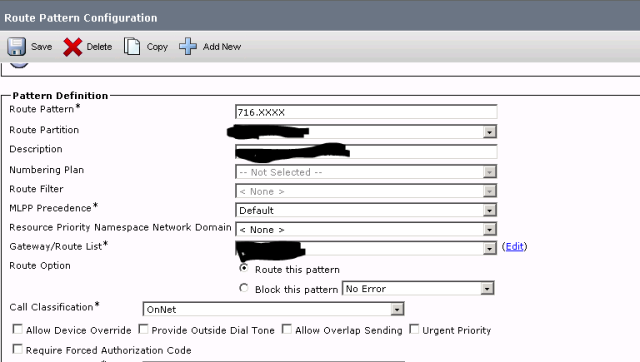
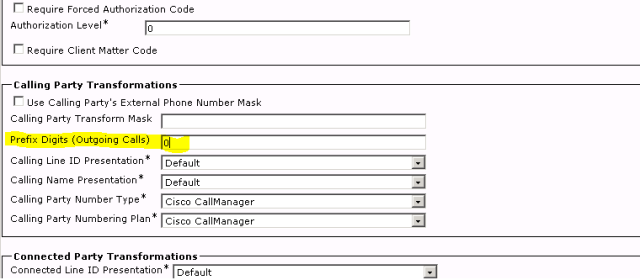
 At this point my job was pretty much done.  I confirmed that the route pattern was responsible for sending calls to the PBX by checking the route list. I also confirmed that this route pattern  is the route-pattern  that was responsible for sending the calls to the PBX with an extra zero. It was the root cause of the problem. So the cause of the problem was Cisco call manager and not the PBX.   All I did was to remove the prefix of Zero and the problem was resolved. The client was very happy and straight away dropped another problem that needed solving on my lap. . .  lol     🙂     from frying pan to fire 😉

Anyway, I  hope you enjoyed this case as much as I did

Cheers


 * Hint:Please note that some of the screenshots and outputs in this post have been recreated in a lab

This was another interesting case that was raised with me by one of our clients. This client has a PBX (Aastra Communications server) integrated with Cisco Call Manager via a Sip Trunk.

The client configured Single-number-reach or mobile connect. The way the client configured it was such that an internal CUCM number of 5737 had 07578334371 configured as one of  its remote destinations. The second  remote destination was configured as 875737. This extension is the user’s other extension that is  hosted on the SIP-PBX.

So in essence each user had three phones, a  Cisco phone, a Sip-based mobile PBX phone, and a normal mobile phone.   As you might already know, the way presence works on  mobile-connect  is that when a user calls into the company with his Sip-based mobile PBX phone or normal mobile phone, their internal line (cisco)   presence status would be updated to ‘off hook or ‘On a call’. So what I mean is that  if a user calls from his Sip PBX phone to another internal user’s internal number, everyone would be able to see the external caller’s status as on ‘ on a call’ or ‘off hook’ .

However, this was not working for my client. The presence status was triggering fine when calling into the network from mobile phones but it was not triggering from the Sip-based mobile PBX phones.

In order to test this, I told the client to call an internal   Cisco IP-phone (extension 3250) using his PBX phone (extension 785737) which is mapped to his internal number of 5737 as a remote destination or mobile connect number.

I collected the trace of the call and this is what I found:


:::::::::::::::

:::::::::::::::::::::::::::::::::::::::::::::::::::::::::::::::

::::::::::::::::::::::::::::::::::::::::::::::::::::::::::::::::::::::::::::::::::

INVITE sip:3250@10.xx.96.x8 SIP/2.0

Via: SIP/2.0/UDP 10.xx.6.x02:5060;rport;branch=z9hG4bK2013Apr1753552443250

To: <sip:3250@10.xx.96.x8>

From: “Mark o’neil” 7@10.xx.96.x8>;tag=AI51E9A11E80AFDF6C

Call-ID: AIBD1912FE6B7F686C@10.xx.6.x02

CSeq: 1 INVITE

Max-Forwards: 70

Contact: sip:5737@10.xx.6.x02>

Accept: application/sdp

Allow: ACK,BYE,CANCEL,INVITE,NOTIFY,OPTIONS,UPDATE

Allow-Events: dialog,message-summary,refer

Privacy: none

Supported: timer

User-Agent: Aastra 400

Session-Expires: 1800

Min-SE: 300

Content-Type: application/sdp

Content-Length: 316

v=0

o=aastra400 442514688 442514688 IN IP4 10.xx.6.x02

s=call

c=IN IP4 10.xx.7.x01

t=0 0

m=audio 16380 RTP/AVP 0 8 18 4 101

a=rtpmap:0 PCMU/8000

a=rtpmap:8 PCMA/8000

a=rtpmap:18 G729/8000

04/17/2013 15:53:55.370 CCM|//SIP/SIPCdpc(0,0,0)/ci=0/ccbId=0/scbId=0/globalize: Performing stripAndPrependDigits — Prefix data = , Strip Data = 0|

04/17/2013 15:53:55.370 CCM|//SIP/SIPCdpc(0,0,0)/ci=0/ccbId=0/scbId=0/globalize: CallingNumber after stripAndPrependDigits 5737|

04/17/2013 15:53:55.370 CCM|SPROC getCtrlPid – callingNum=5737, inputCtrlPid=(5,100,175,1)|

04/17/2013 15:53:55.370 CCM|DbMobility: getMatchedRemDest starts: cnumber = 5737|

04/17/2013 15:53:55.370 CCM|DbMobility: getMatchedRemDest: full match case|

04/17/2013 15:53:55.370 CCM|DbMobility: can’t find remdest 5737 in map|

:::::::::::::::

:::::::::::::::::::::::::::::::::::::::::::::::::::::::::::::::

::::::::::::::::::::::::::::::::::::::::::::::::::::::::::::::::::::::::::::::::::

Did you notice what was wrong with that call? Did you noticed that the  in-coming caller-ID was 5737 instead of 875737?   Did you also notice that the wrong caller-ID  which   later caused a problem? If you look at this part of the trace copied below;

‘: getMatchedRemDest starts: cnumber = 5737

can’t find remdest 5737 in map

You will noticed that after the call came in and the digit manipulation that is configured on the sip trunk had been completed, the call manager was actually trying to check whether the in-coming caller-ID was actually configured as a remote destination for any user on the system. But in the end, the call manager  decided that the number was not configured as a remote destination for any user so the presence status of any internal number was never triggered.  For the internal line presence status to change, the incoming caller-ID needs to match one of the numbers already configured as a remote destination of an internal number.

I got the PBX engineer to make sure that the PBX was sending the full number and after that I collected another trace for the call. This is what I found:

:::::::::::::::

:::::::::::::::::::::::::::::::::::::::::::::::::::::::::::::::

::::::::::::::::::::::::::::::::::::::::::::::::::::::::::::::::::::::::::::::::::

INVITE sip:3250@10.xx.96.x8 SIP/2.0

Via: SIP/2.0/UDP 10.xx.6.x02:5060;rport;branch=z9hG4bK2013Apr2647493143250

To: <sip:3250@10.xx.96.x8>

From: “Mark o’neil” <sip:875737@10.xx.96.x8>;tag=AIB932DDBF63C8339D

Call-ID: AIC245C802CF7BDC00@10.76.6.102

CSeq: 1 INVITE

Max-Forwards: 70

Contact: <sip:875737@10.xx.6.x02>

Accept: application/sdp

Allow: ACK,BYE,CANCEL,INVITE,NOTIFY,OPTIONS,UPDATE

Allow-Events: dialog,message-summary,refer

Privacy: none

Supported: timer

User-Agent: Aastra 400

Session-Expires: 1800

Min-SE: 300

Content-Type: application/sdp

Content-Length: 318

v=0

o=aastra400 1213022154 1213022154 IN IP4 10.xx.6.x02

s=call

c=IN IP4 10.xx.6.x03

t=0 0

m=audio 16386 RTP/AVP 0 8 18 4 101

a=rtpmap:0 PCMU/8000

a=rtpmap:8 PCMA/8000

a=rtpmap:18 G729/8000

a=fmtp:18 annexb=no

a=rtpmap:4 G723/8000

09:47:50.116 CCM|//SIP/SIPCdpc(0,0,0)/ci=0/ccbId=0/scbId=0/globalize: Performing stripAndPrependDigits — Prefix data = , Strip Data =

04/26/2013 09:47:50.116 CCM|//SIP/SIPCdpc(0,0,0)/ci=0/ccbId=0/scbId=0/globalize: CallingNumber after stripAndPrependDigits 87573704/26/2013 09:47:50.116 CCM|SPROC  getCtrlPid – callingNum=875737,

04/26/2013 09:47:50.116 CCM|DbMobility: getMatchedRemDest starts: cnumber = 875737

04/26/2013 09:47:50.116 CCM|DbMobility:initRemDest: device pkid [97c71d1f-24f7-1f82-107d-

04/26/2013 09:47:50.116 CCM|DbMobility: found DN association for remdest [875737]| 04/26/2013 09:47:50.116 CCM|DbMobility: found remdest cnumber = 875737, devicepkid =

-1f82-107d-4c77053bc79f found in RemoteDeviceInfo hashmap – PID(s)=2 Name=875737:RDP-marko-5737 is Active=1 Protocol=Remote Destination

:::::::::::::::

:::::::::::::::::::::::::::::::::::::::::::::::::::::::::::::::

::::::::::::::::::::::::::::::::::::::::::::::::::::::::::::::::::::::::::::::::::

Notice that the incoming caller-ID was sent in full and the result was that  a remote destination match was discovered by the call-manager  as be seen in the output copied below?

(‘-1f82-107d-4c77053bc79f found in RemoteDeviceInfo hashmap – PID(s)=2 Name=875737:RDP-marko-5737 is Active=1 Protocol=Remote Destination ’)

As soon as the match was made, the presence status of internal extension of 5737 was trigger and updated to ‘ off hook’ or ‘on a call’ and everyone in the company could now see extension 5737 as being on the phone even though the user  was using his remote destination phone of  875737.

. . . and that was how my client was instantly made happy and of course I was glad to have gotten to the bottom of it.

Cheers folks,

Hope it has been an interesting read


* Hint: Please click on the picture in order to maximize it

I thought I’d simply add this blog entry because I have found this topic being talked about all over the internet yet I have never found one person shedding full light on    the solution (I’ve probably not looked hard enough). I suspect people could not readily provide the answer to the problem because it’s very rarely requested for by end users. In fact I have only been asked to do this once in my entire existence on this planet and I did scratch my head when I was first asked to do it . The question sounds very daft, but let me ask it; how do you switch off the call-waiting sound or alert tone a user  hears on a Cisco IP-phone running on Cisco Call-manager when a second call comes in during an active call? Were you expecting me to ask about how you can build a server from scratch? : – )

If that question caught you off-guard, well take solace in the fact that you are not the first to be caught off-guard  by this one.  : – )  Try your luck and ask a CCIE lol.

Anyway, to cut a long story short, in order to do this:

1)      Log unto CUCM admin page

2)      Go to service parameters and select call-manager

3)      Scroll through the parameters and you will see a parameter called ‘Ring Setting of Busy Station’

4)      Just set the setting to ‘ flash only’

Ring setting of Busy Station

In my case, I had to reset the Jabber clients in order for the jabber client to pick up the config.

Cheers


* Hint: If this video becomes  fuzzy or unclear, please just switch to HD mode.

* Hint: Please note that this  Java Script  was created for a version 8.5x Cisco Contact Center Express

* Hint:Click on the link below  to download a copy of the script. 

http://rapidshare.com/files/351883425/Split_intl_Calls_from_national%20-%20Copy.aef

This  blog entry is created based on  an interesting case that was assigned to me a few months back:  A client called in and requested that he wanted to be able to divert international calls to a particular number that was maned by a  specialized team of agents while  all other calls divert to another team of agents.   The solution was very interesting  as can be seen from the Video clip below.   However, for the purpose  of this blog, I have created a script that separates  callers with a London caller-ID from all other callers since the methodology is the same.


* Hint: If this video becomes  fuzzy or unclear, please just switch to HD mode.

* Hint:Please note that some of the screenshots and outputs in this post have been recreated in a lab

* Hint: Please click on the pictures in order to maximize them

As we  know, the problem of one-way audio is very popular in the word of  IP telephony and when it occurs, everyone thinks its the telephony system that’s got a problem. However, 90% of the time, it’s the underlying network that’s causing the problem.   This video entry is geared towards providing a method for determining whether the phones in a a call are actually sending audio packets when users are complaining of one-way audio or no audio at all.


 * Hint:Please note that some of the screenshots and outputs in this post have been recreated in a lab

 * Hint: Please click on the pictures in order to maximize them

This was a case that turned out to be another unexpected ticket which had a few gatchas up it’s sleeves.  The issue started off with a client side engineer stating that he could not log into one of the nodes of his Unity Connection cluster.  As soon as I got this information, I Jumped on the cluster in order to see what was happening.

I tried logging into the Web graphical user interface but I got an error message instead. The error message said; ‘database communication error’. I logged unto the subscriber server and that was fine.  I then decided to log into the Publisher server via the command line interface.

As soon as I logged on, I saw these errors:

Command Line Interface is starting up, please wait …
java.io.FileNotFoundException: /var/log/active/platform/log/cli.bin (Read-only file system)
at java.io.RandomAccessFile.open(Native Method)

log4j:ERROR No output stream or file set for the appender named [CLI_LOG].
Welcome to the Platform Command Line Interface

The /common file system is mounted read only.
Please use Recovery Disk to check the file system using fsck
.

At this point, it was clear that the system had gone into read-only-mode and would have to be recovered. The team agreed to recover this server whilst planning a full rebuild.

After the server was recovered, two days later it crashed again so a rebuild was now the only reasonable thing to do. The responsibility fell on me so I rushed to create a new VMware Virtual Unity Connection server. In approaching this case, I created a plan that ensured that I was following Cisco’s best practice recommendations and that I would be able to kick-start the new server and everything would work perfectly.  My plan was to make sure that the new server was as similar to the old one as possible so I made sure the following variables were the same:

1)      Server Hard-drive size

2)      Server memory size

3)      Server NTP Server

4)      Server IP –address

5)      Server Default-Gateway IP

6)      Cluster  security password

7)      Same server version as the old server

8)      Server host-name

Whilst it’s not necessary to use an OVA Template, I decided to use the template shown in the screenshot below as Unity ova template formats the drive in 64kB Blocks which results in ‘ improved storage input/output operation.

one

It is very crucial for the hostname to be the same as the failed server otherwise; the subscriber will complain that the new publisher’s host-file does not match the host-file that it has in its database. So what was needed was to basically trick the subscriber into believing that its connected to the original Publisher server when we connect them up.

So I loaded the Unity Connection installer and started building. As can been seen in the screenshot below, after a while, I got to the part where I had to enter the cluster certificate information.

two

As I did not have this information readily at hand and I was paranoid about build a near exact replica, I logged unto the subscriber unity connection server and then navigated to

i)                    OS admin page

ii)                   Security

iii)                 Certificate management

iv)                 And I selected the tomcat trust certificate

From the screen-shot below, did you noticed that all the information that was required of me in the screenshot above was actually  listed screenshot  below?

three

After filling in the required fields, I selected ‘ next’ on install process.

I was then asked by the install script if this was the first server in the cluster: I selected yes.

After while, the installation process seemed to have frozen or hung.  After a quick rummaging of the internet, I discovered that the server was actually installing in the background: The server appeared to have frozen because it was experiencing Bug  CSCtj33840 so I ignored it and after a while the installation completed.

After the server had rebooted, I followed Cisco’s upgrade guide and did the following.


Step 1 Sign in to Cisco Unity Connection Administration on the publisher server.

Step 2 In Cisco Unity Connection Administration, expand System Settings, then select Cluster.

Step 3 On the Find and List Servers page, select Add New.

Step 4 On the New Server Configuration page, in the Hostname/IP Address field, enter the hostname or IP address of the subscriber server.

Step 5 In the Description field, enter a description for the subscriber server.

Step 6 Select Save.

Step 7 Sign out of Cisco Unity Connection Administration.


To Connect the Subscriber Server to the New Connection Cluster, and Replicate Data and Messages to the Publisher Server


Step 1 Sign in to the command-line interface (CLI) for the subscriber server.

Step 2 Run the CLI command utils cuc cluster renegotiate.

After issuing this command, I got the output below:


This command may take require several hours to complete. The duration 

depends on the network bandwidth between servers and on the

total size of the data on this subscriber server.


Are you sure you want to continue? (y/n) : y


13/03/03 08:31:47  Disabling data replication…

13/03/03 08:31:57  Renegotiating ssh trusts…

13/03/03 08:31:59  Syncronizing platform and LDAP database…

13/03/03 08:35:07  Creating any missing messaging databases on the publisher…

13/03/03 08:35:10  Adding subscriber node to publisher…

13/03/03 08:35:12  Synchronizing Unity Connection databases…

13/03/03 08:41:05  Synchronizing file systems…

13/03/03 08:41:06  Synchronizing message files for mail store UnityMbxDb1…

13/03/03 08:41:07  Copying cluster DSCP configuration to publisher node…

13/03/03 08:41:08  Rebooting publisher node v8-unity-conn-192-168-0-56…

13/03/03 08:41:10  Cluster renegotiation completed.


Process completed. 


After the completion, I checked the cluster status by issuing the command ‘ show cuc cluster status’ and everything was fine.

The next phase was to re-host the license files from the old server to the new server but in order to do this; I needed the value of the license-mac of the new server. The information below proved crucial.

Host Name    : publisher-cuc

Date         : Sat Mar 2, 2013 09:34:39

Time Zone    : Greenwich Mean Time (Europe/London)

Locale       : en_US.UTF-8

Product Ver  : 7.1.5.30000-1

Platform Ver : 2.0.0.1-1

License MAC  : 0ce90be10d98

As can be seen above, I logged into the command line interface of the new publisher and issued the command ‘show status’. I then copied and sent the new ‘License-Mac’ to Cisco who then sent me the new license file which I then installed.

The server has been happy ever since. . .


* Hint: Please click on the pictures in order to maximize them


So after working for a client on a Meeting-Place related issue, this particular case took centre stage in our closing remarks/ conversation. The client complained that every now and then, Cisco Tomcat Service would crash and results in the problems listed below:

1)      Admin and end-Users cannot log into Call-Manager web pages when the server fails. The client noted that even after a Cisco Tomcat Service restart, the time required to load a Call-Manager page would continuously degrade/increase  as time elapses.

2)      The client also informed me that their corporate directory also crashes when the Tomcat service crashes.

I then decided to do a quick diagnostic test on the server’s CLI by issuing ‘utils diagnose test After issuing the command, I got the output below:

admin: utils diagnose test
Log file: platform/log/diag2.log
Starting diagnostic test(s)
===========================
test – disk_space : Passed (available: 24897 MB, used: 11727 MB)
skip – disk_files : This module must be run directly and off hours
test – service_manager : Passed
test – tomcat : Passed
test – tomcat_deadlocks : Passed
test – tomcat_keystore : Passed
test – tomcat_connectors : Passed
test – tomcat_threads : Passed
test – tomcat_memory : Passed
test – tomcat_sessions : FailedThe following web applications have an unusually large number of active sessions: axl. Please collect all of the Tomcat logs for root cause analysis: file get activelog tomcat/logs/*
test – validate_network : Passed
test – validate_network_adv: Passed
test – raid : Passed
test – system_info : Passed (Collected system information in diagnostic log)
test – ntp_reachability : Passed
test – ntp_clock_drift : Passed
test – ntp_stratum : Passed
skip – sdl_fragmentation : This module must be run directly and off hours
skip – sdi_fragmentation : This module must be run directly and off hours
test – ipv6_networking : Passed
Diagnostics Completed

At this stage, I was quite happy that the diagnostic test had not only discovered the location of the problem, but had also pointed me in the right direction with regards to collecting the appropriate logs.  However, I had one problem with the output: If I followed the directions of the output and issued the command; ‘ file get activelog tomcat/logs/*’ ,  I would essentially be pulling all the logs in that directory when I only really needed the ‘.hprof ’  file.

As can be seen in the screenshot below, I then decided that the best thing to do was to collect the specific ‘.hprof’ file for the specified time-stamp.

rtmt

The next phase was to pass the .hprof file through Eclipse Memory Analyser as can been seen in the screenshot below.

The steps followed were

i)                    Click file menu

ii)                   Select open heap dump

iii)                 Select the ‘.hprof’ file extracted from CUCM using RTMT

iv)                 Then click finish.

eclipse

leak1

leak2

So from the screenshot above, when the trace heap-file was analysed, com.rsa.sslj.xcu was seen to be consuming over 75.81% of memory heap. I had already been combing the internet and doing Bug-scrubs on Cisco’s Bug Tool Kit so I was sure I had hit bug CSCty36110


I double checked the bug’s details (screenshot below) at Cisco’s website and it confirmed my conclusion. It stated that if I see ‘com.rsa.sslj.x.cu’ as being the major cause of the Tomcat Crash when analyzing the trace, I should know that I am hitting bug CSCty36110.

It was at this point that I recommended an upgrade of CUCM to version 8.6.2.22900.9 as it is a version that has the fix

Another case had been seen to its end and I was relaxed.


toolkit


If you are visiting for the first time then I would like to say welcome to Voice Initiate. It is a place where experiences are shared and discussed.  As we all know, working in technology is all about being introduced to new things on an almost daily basis. For me, it’s like being in a perpetual state of initiation.

If you are reading this blog then I’m sure you can relate when I say that I came into the IP telephony world not knowing that I would have to learn programming too, but working on Contact Centers dictates  that  you must- so retreat was never an option. . . it’s an endless battle but we love it anyway.

This blog is an account of the joys and challenges faced by a Unified Communications NOC Engineer. This is a  place where both failure and success is discussed openly.

Advice and contributions are always welcomed.  My hope is that this blogs brings a sense of thrill to fellow bloggers and initiates alike and a sense of nostalgia to those that have seen the joys and challenges that we now speak of .

Cheers!

maxwell.osagie@yahoo.com